

Author:Encryption Tracker
XRP is currently at risk of recording seven consecutive monthly losing candles for the first time since the 2013/2014 cycle.
The broader crypto market remains in a multi-month downtrend, and XRP has been one of the biggest losers, down 63.6% from its July 2025 peak. Amid the selling pressure, XRP is now on track to see a seventh consecutive monthly loss unless April turns the tide around.
Key Points
- XRP has declined 63.6% from its July 2025 peak of $3.6 and 28.4% since the start of this year.
- The ongoing downturn has led to six consecutive monthly losing candlesticks since October 2025, with XRP on track to record a seventh one.
- The last time XRP saw such an extensive losing streak was in the 2013/2014 cycle.
- Historical data shows that a 900% rebound ensued shortly after the 2014 trend, as XRP became incredibly undervalued.
- The XRP monthly RSI has now dropped to its lowest since the 2022 FTX collapse.
XRP Sees Six Consecutive Monthly Losses
For context, the ongoing market-wide turbulence began in October 2025 in the aftermath of the 10/10 market crash that led to record liquidations across the board. Bitcoin (BTC) and the rest of the crypto market suffered the heat, but XRP saw some of the steepest losses.
This trend has persisted until now, with XRP consistently seeing lower highs and lower lows since October 2025. While the market recorded five consecutive monthly losses, BTC and a few other tokens broke this losing streak in March 2026, when they recorded their first monthly gain of the year.
XRP was one of the unlucky tokens that sustained the bearish trend, seeing declines in March and maintaining a streak of six consecutive monthly losses. Interestingly, XRP had not witnessed such an extensive losing streak for over a decade, as even the Terra and FTX implosions of 2022 triggered only three consecutive monthly losses each.
At Risk of a Seventh Monthly Loss
While XRP began April on a good note, the bullish momentum quickly faded on the first day of the month. So far, the token has recorded declines this month, down 1.8% at press time. This puts XRP at risk of its seventh consecutive monthly loss unless things turn around for good in April.
The last time XRP saw this extensive losing streak was during the 2013/2014 cycle, when it recorded red candlesticks from December 2013 to June 2014. Within this stretch, XRP saw a whopping 90% loss in value, crashing from $0.0383 to $0.0038 by the time the downtrend ended.
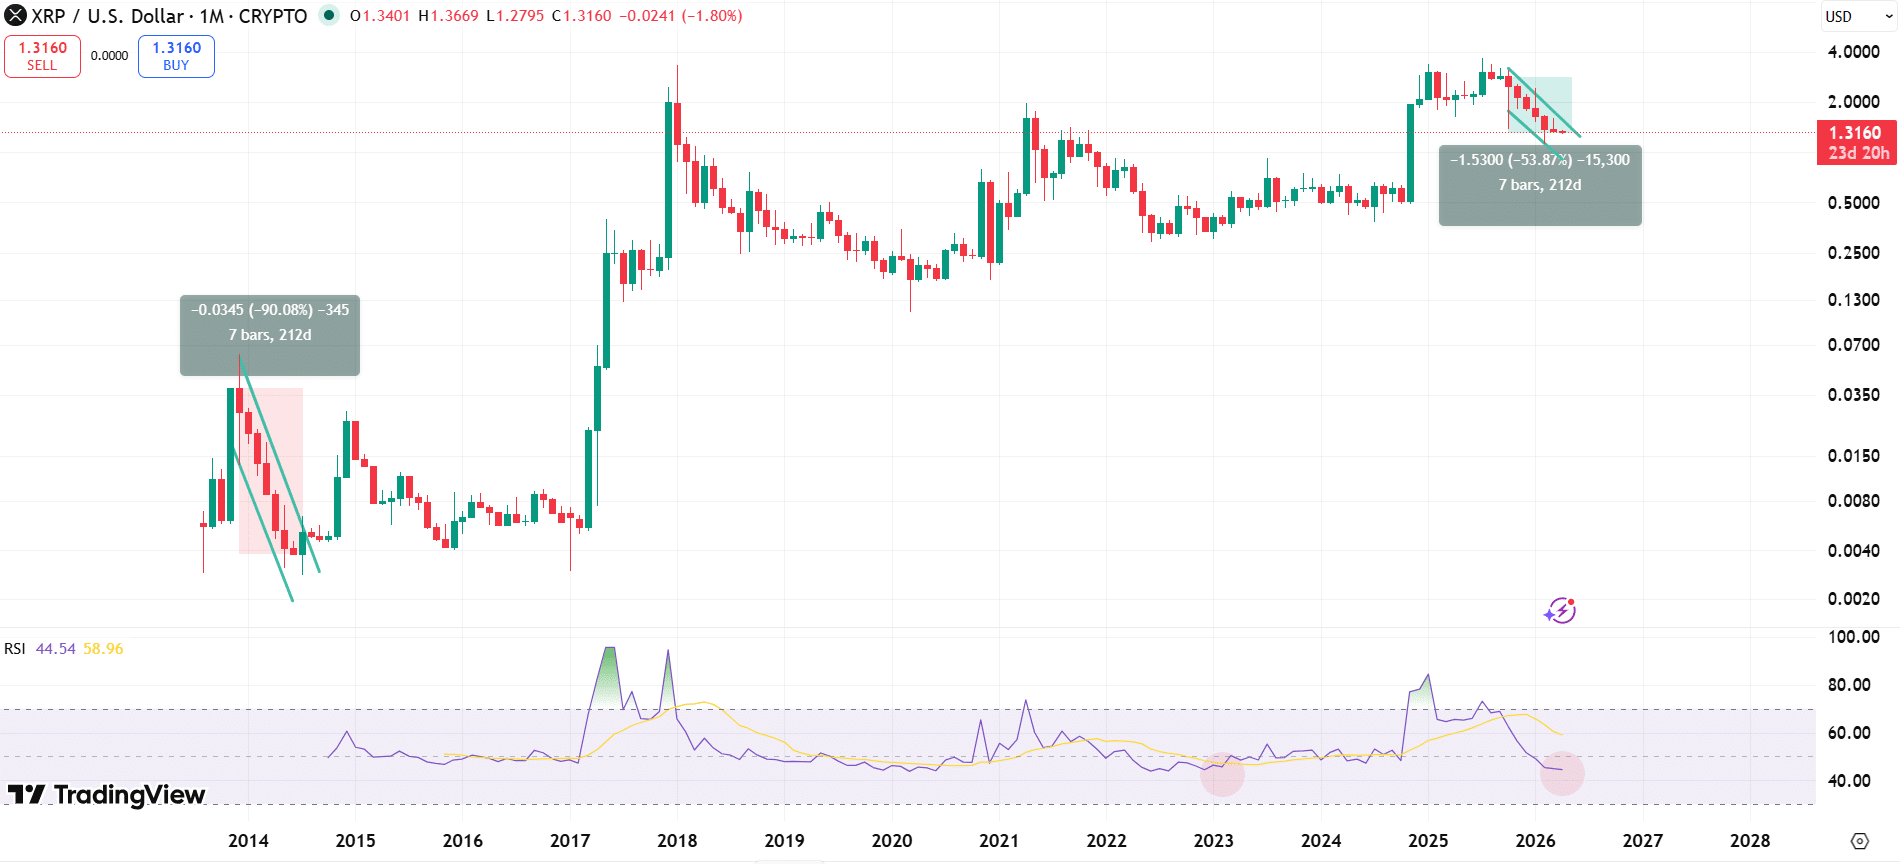
What followed was an impressive rebound push, as the persistent selling pressure resulted in steep undervaluation. Specifically, XRP soared from a low of $0.0028 in July 2014 to a high of $0.0280 by December 2014. This marked a 900% increase within five months.
XRP RSI Now at Its Lowest Since the FTX Implosion
Interestingly, chart data confirms that XRP may be experiencing similar levels of undervaluation amid the current downtrend. Notably, the monthly RSI has dropped to 44.54 at press time, from a high of 73.08 in July 2025.
The last time the XRP monthly RSI recorded such low readings was in December 2022 after the FTX implosion. At the time, the price stood at $0.40. Experiencing similar lows at current prices of $1.31 confirms XRP’s growth since then. If the price witnessed a loss in April and recorded only half of the 2014 surge, it could reach a new peak of $7.2.