

Author:Chain Wizard
Original author /Castle Labs
Compiled by Odaily Planet Daily Golem@web 3_golem)

Editor's Note: This article systematically studies the differences between Hyperliquid and CME crude oil contract trading data during weekday and weekend sessions, and draws some important conclusions. Currently, Hyperliquid cannot match CME in absolute indicators such as liquidity depth or slippage, with overall liquidity less than 1%. This is related to the fact that the main users of the RWA trading platform are still crypto-native retail investors.
What sets Hyperliquid apart is that trading volume for crude oil contracts on Hyperliquid increases significantly over the weekend.This indicates that in addition to retail investors with speculative needs, traders who wanted to gain exposure to crude oil trading and conduct hedging operations before Monday were also trading on Hyperliquid over the weekend.This trend is becoming increasingly apparent, giving Hyperliquid the ability to discover prices for commodities.
However, for institutional investors, Hyperliquid's high transaction costs compared to CME remain a major obstacle to its expansion in the commodities trading sector. If Hyperliquid doesn't develop the capability to handle institutional orders soon, it will remain merely a temporary trading venue for traditional traders on weekends, ultimately becoming a small supplement to the traditional financial landscape.
Research Methodology and Data Sources
This analysis assesses the microstructure of the crude oil market through two studies, covering both weekday and weekend markets, and utilizes tick-by-tick data from two exchanges: Hyperliquid's xyz:CL perpetual contract and the Chicago Mercantile Exchange (CME) CLJ6 (April 2026 NYMEX WTI crude oil futures) contract.
CME data originates from the Databento trading data source, which captures tick-by-tick trades rather than order book snapshots. Therefore, all CME depth and slippage estimates are based on actual trading volume, not quote depth. Hyperliquid data comes from Hyperliquid's publicly available S3 database, which contains complete on-chain transaction records.
therefore,The analysis of both trading venues is based on actual trading volume.All depth data represents explicit liquidity, which is the volume within a specific basis point range within a 5-minute window of the VWAP midpoint, rather than the full resting depth on the order book.
Research period and market background
The research period is from February 27 to March 16, 2026, a period that coincides with the geopolitical turmoil following Iran's attack on February 28, 2026.
- Market close before the attack: The last CME trading day before the attack.
- Monday's opening: Market reopening faced significant pressure, with CME shares gapping up sharply, while the Hyperliquid xyz:CL market was constrained by discovery boundaries.
- Over the following weekends, high oil prices and market volatility led to consistently high crude oil trading volumes on the Hyperliquid platform.
xyz:CL launched in early 2026, meaning this three-week observation period covered the early maturation phase of the Hyperliquid market. Observed trends, including increased liquidity depth, trading volume, and user growth, partly reflect market maturity. However...We believe that on-chain exchanges currently cannot compete with traditional exchanges in terms of absolute metrics such as liquidity depth and slippage..
Our research aims to track directional trends: whether the price difference is narrowing, how fast it is narrowing, and under what conditions it is narrowing.
Data Analysis
The data analysis is divided into two parts based on the time period:
- Weekday Trading Hours: Covering a full three-week period, this analysis compares market depth, slippage, and premium/discount rates for Hyperliquid and CME trading during weekday trading hours. For Hyperliquid, we also analyzed its funding rates over the entire period.
- Weekend Session: Within a given timeframe encompassing three weekends, we analyzed price discovery and the price gap deviation of Hyperliquid relative to the CME opening price.
Weekday Time Period Data Analysis
This analysis covers a full three-week period, with a focus on periods when both exchanges are active simultaneously.
Liquidity depth is measured by USD trading volume within ±2, ±3, and ±5 basis points of the VWAP midpoint per 5-minute interval, and aggregated as the median across all weekday intervals. As mentioned above, this reflects volume within the interval, not resting quote depth. This approach may underestimate liquidity depth at CME and Hyperliquid.
Slippage is estimated using a synthetic order book sorted by execution price. Within each 5-minute timeframe, observed take orders are sorted in ascending price order (simulating sell orders) and executed sequentially until the target order size is reached. The arrival price is set to the lowest execution price within that timeframe (representing the best selling price when the order arrives). Slippage is calculated as the difference between the execution volume-weighted average price (VWAP) and the arrival price, expressed in basis points. This method is applied to incremental order sizes from $10,000 to $1,000,000.
Hypeliquid-CME Basis for Weekday Sessions: Tracks the signed price difference between the Hyperliquid midpoint and the latest CME price within a 5-minute window for all weekday sessions. This reflects any structural premium or discount of Hyperliquid relative to the CME reference price during active trading hours. The Hyperliquid midpoint is derived from the volume-weighted average price (VWAP) of trades executed within each 5-minute trading session, rather than from real-time order book quotes.
Hyperliquid financing rates are calculated hourly, expressed in hourly basis points.
Weekend time period data analysis
This analysis focuses on the three different weekend closing times of the CME:
- W1: February 28 to March 1, 2026
- W2: March 7 to March 8, 2026
- W3: March 14 to March 15, 2026
In W1 and W2, Hyperliquid perpetual contracts are restricted, so the mark price cannot exceed the "range limit boundary" (DB).When oracle prices freeze (e.g., when the main reference market (CME) is closed and external price data sources stop updating), the protocol effectively confines prices to a narrow range.
For each weekend window, we will report key data metrics for Hyperliquid xyz:CL, including price, volume, and number of trades. To measure the Monday opening spread deviation, each weekend we will measure the price difference between Hyperliquid and CME at three reference points:
- 3 hours before CME reopens
- One hour before CME reopens
- CME opening price (T=0)
All spreads are expressed in basis points, with positive values indicating that Hyperliquid is trading above the CME opening price and negative values indicating a discount.
Quantitative analysis
This section first analyzes and compares the liquidity of the Hyperliquid xyz:CL HIP-3 crude oil market and NYMEX CLJ6 during overlapping weekday periods.
Liquidity depth: Hyperliquid is less than 1% of CME's.
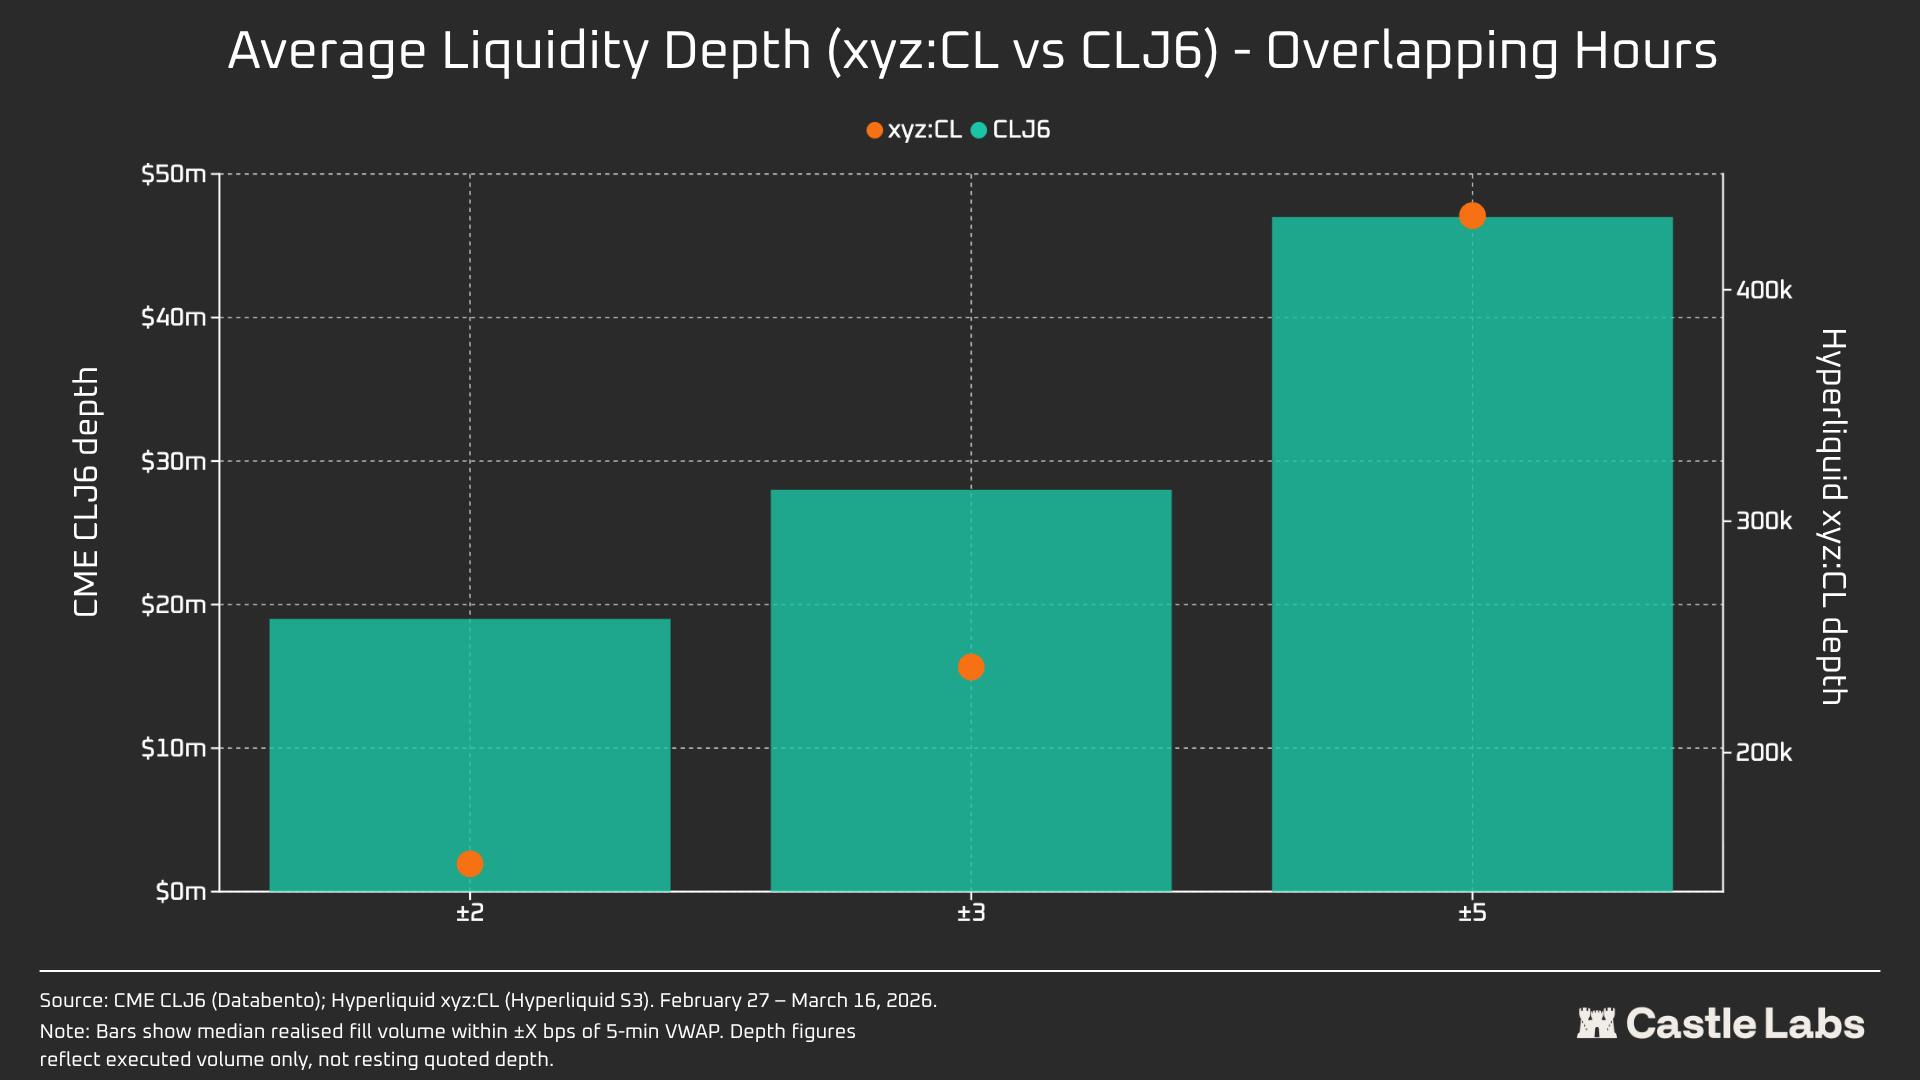
There is no doubt that the liquidity situation of on-chain exchanges is very different from that of CME.On Hyperliquid, CL's average liquidity depth is less than 1% of CLJ6's, and the liquidity depth is consistent across all price ranges (109x at ±5 bps).Within a range of ±2 bps from the midpoint, CME's executable depth is $19 million, while Hyperliquid's is only $152,000, a difference of 125 times.
Given the novelty of the CL marketplace on Hyperliquid and its different target user group, this result is not surprising. The main value of on-chain exchanges lies in providing permissionless trading channels for users traditionally excluded from institutions like CME.
However, as weekend trading volumes on DEXs like Hyperliquid have increased, perceptions of these platforms have begun to shift, with institutional investors showing growing interest in hedging positions outside of trading hours. Therefore, creating a market environment suitable for both traditional and retail investors has become increasingly important for Hyperliquid.
For retail traders with a trading volume of $10,000, this cost difference is negligible. However, for institutional investors with a trading volume exceeding $1 million, the on-chain transaction costs on CL (and most other markets) remain prohibitive.
In fact, the inherent differences among user groups are reflected in the median transaction size during these overlapping market periods.
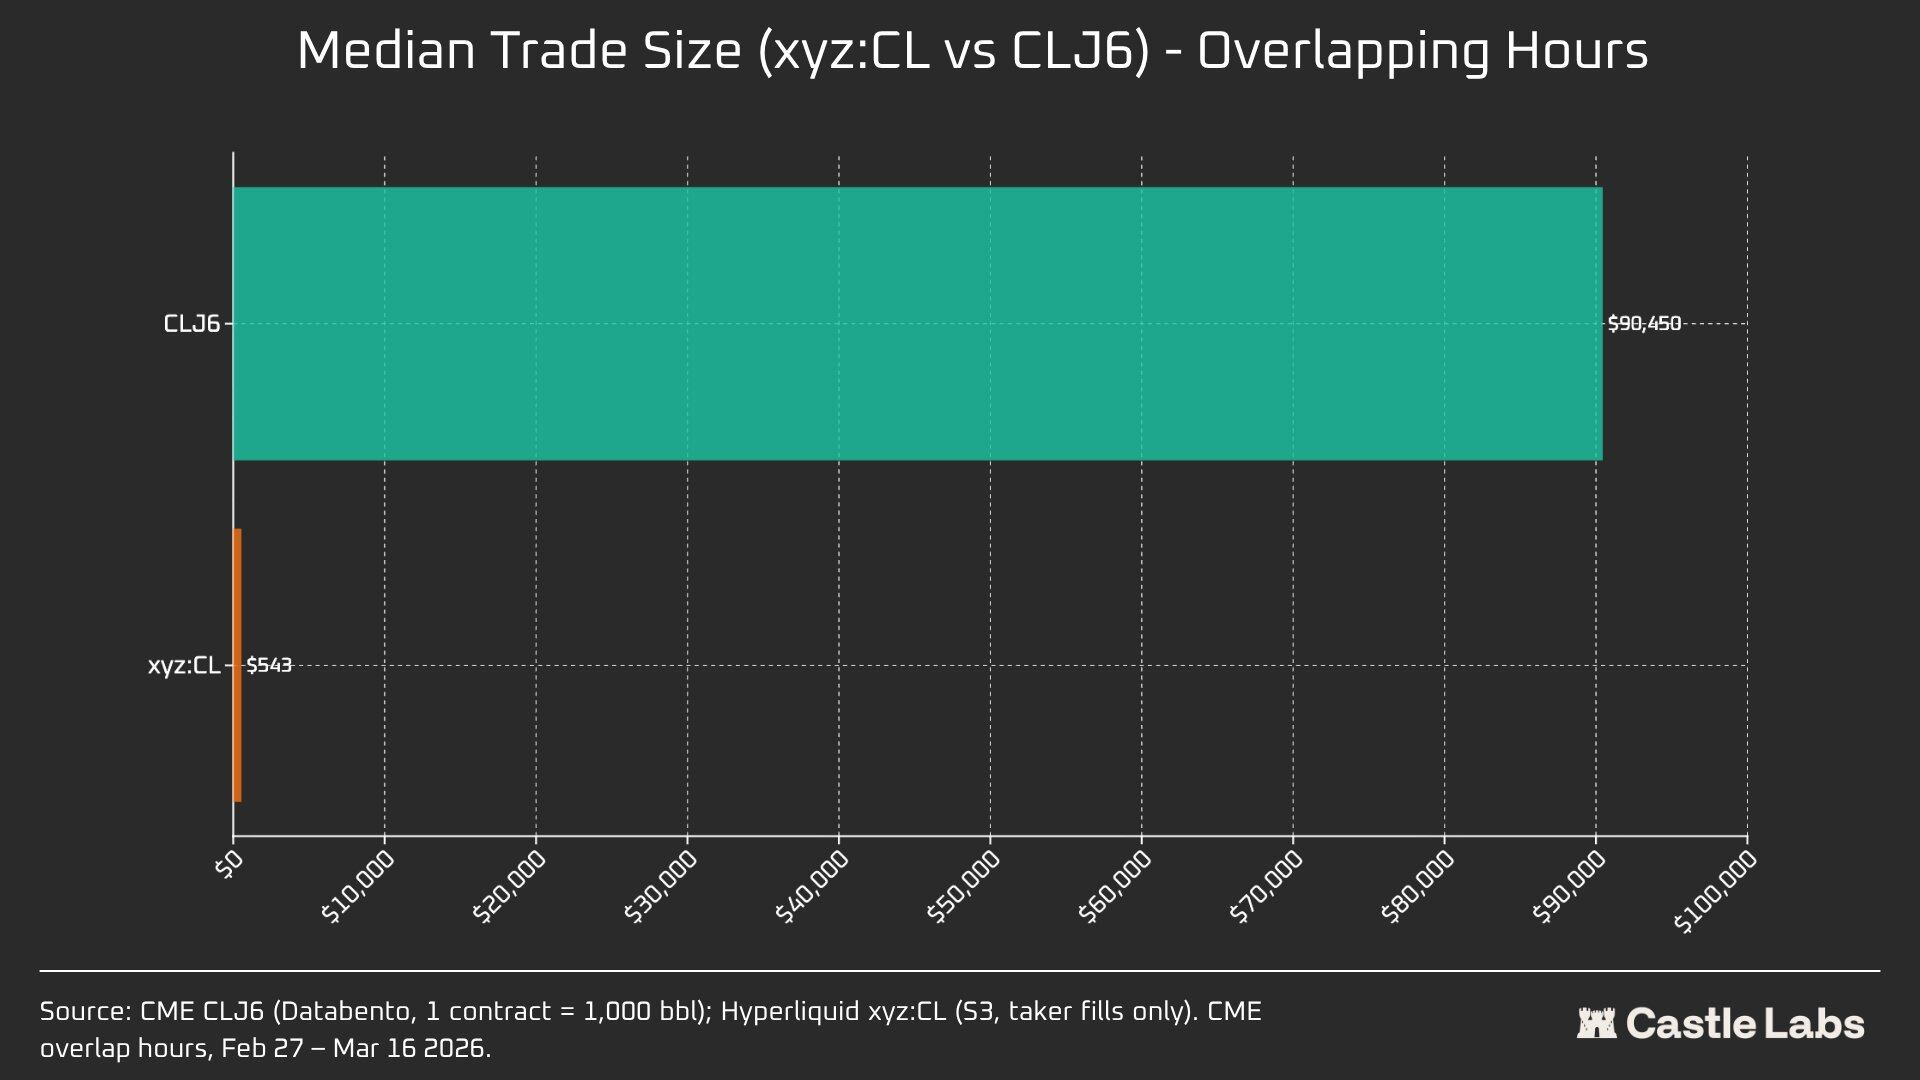
The 166-fold difference in median trade size ($90,450 vs. $543) most clearly demonstrates the fundamental difference in the user groups served by these trading venues.The median trade size for CLJ6 is equivalent to a standard crude oil futures contract (with a notional value of approximately $94,000 at current prices), while the median trade size for Hyperliquid is $543, reflecting the leveraged directional betting activity of native cryptocurrency retail traders.
We anticipate that the median transaction size of the Hyperliquid commodity market will reach an inflection point as these markets become increasingly legitimate in the eyes of more traditional investors and they move funds on-chain.
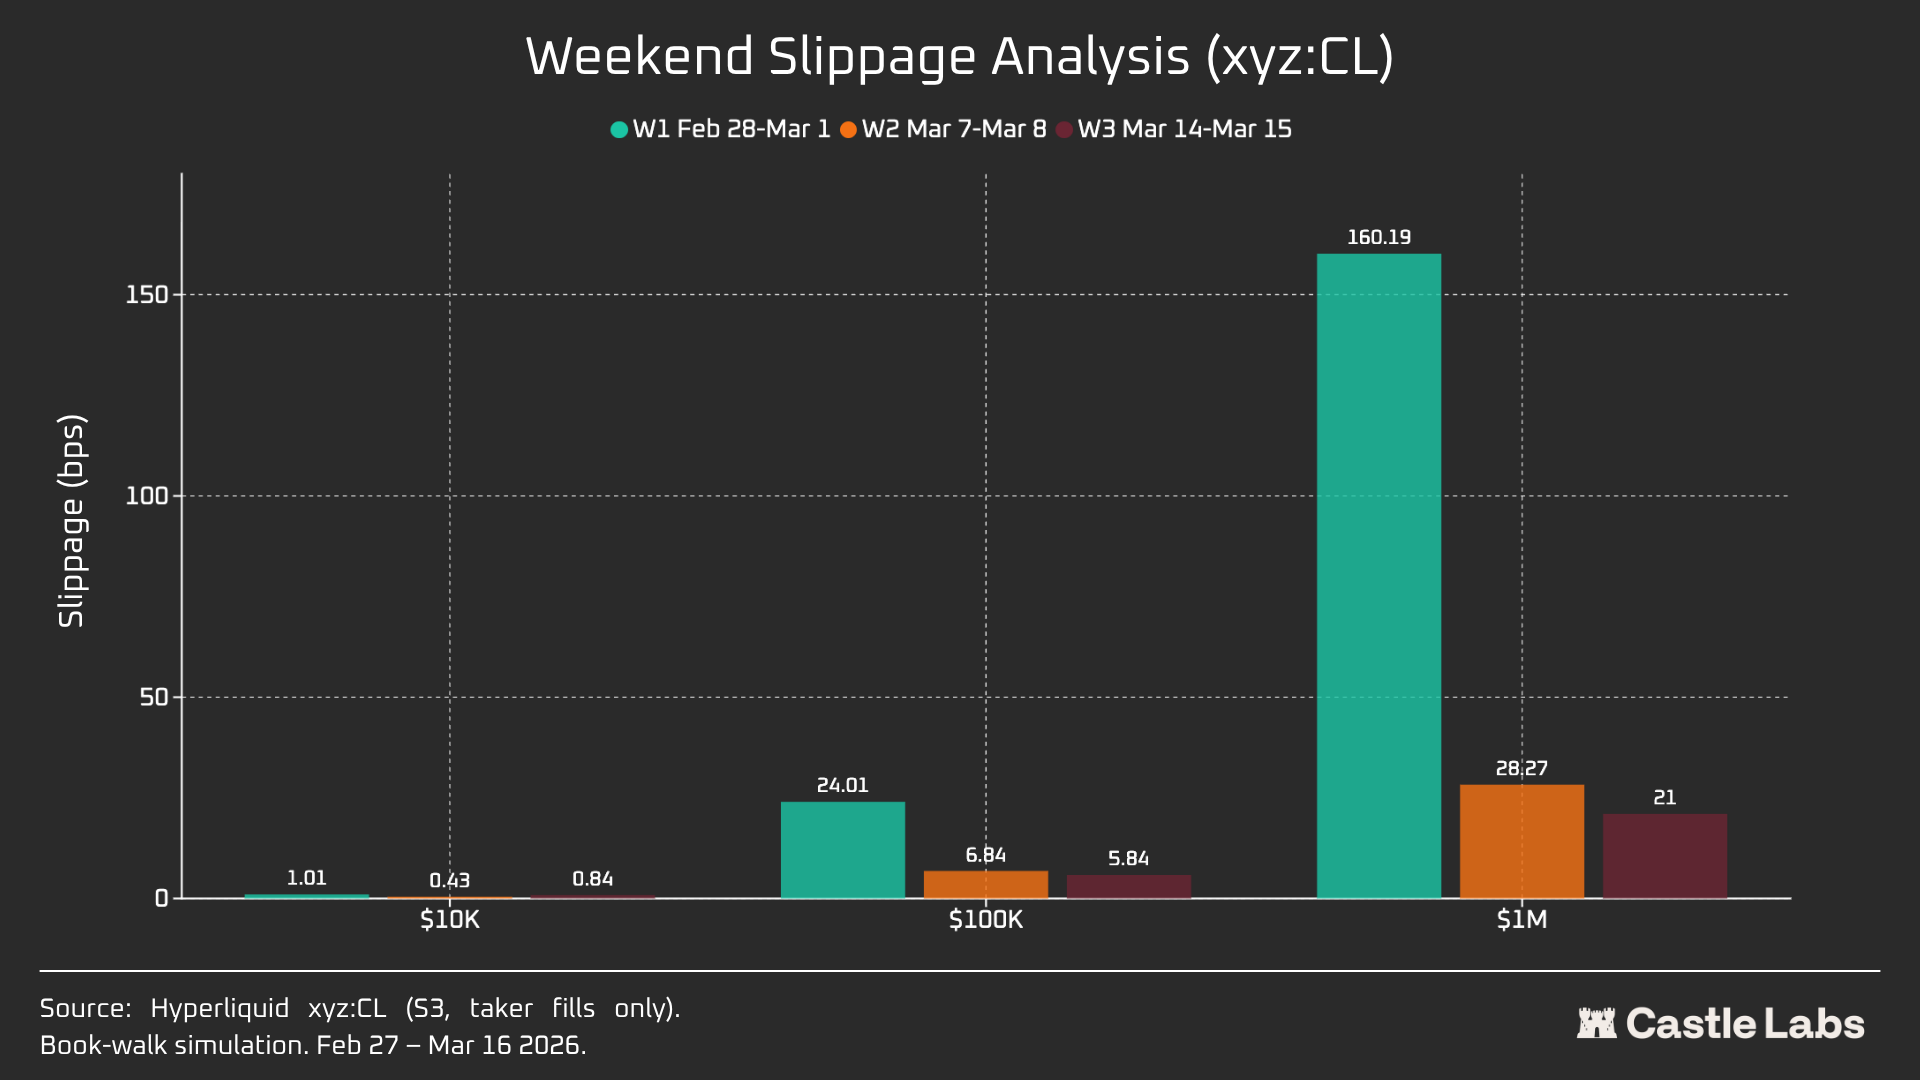
To further differentiate between different transaction sizes, we conducted order simulations with order sizes ranging from $10,000 to $1 million.
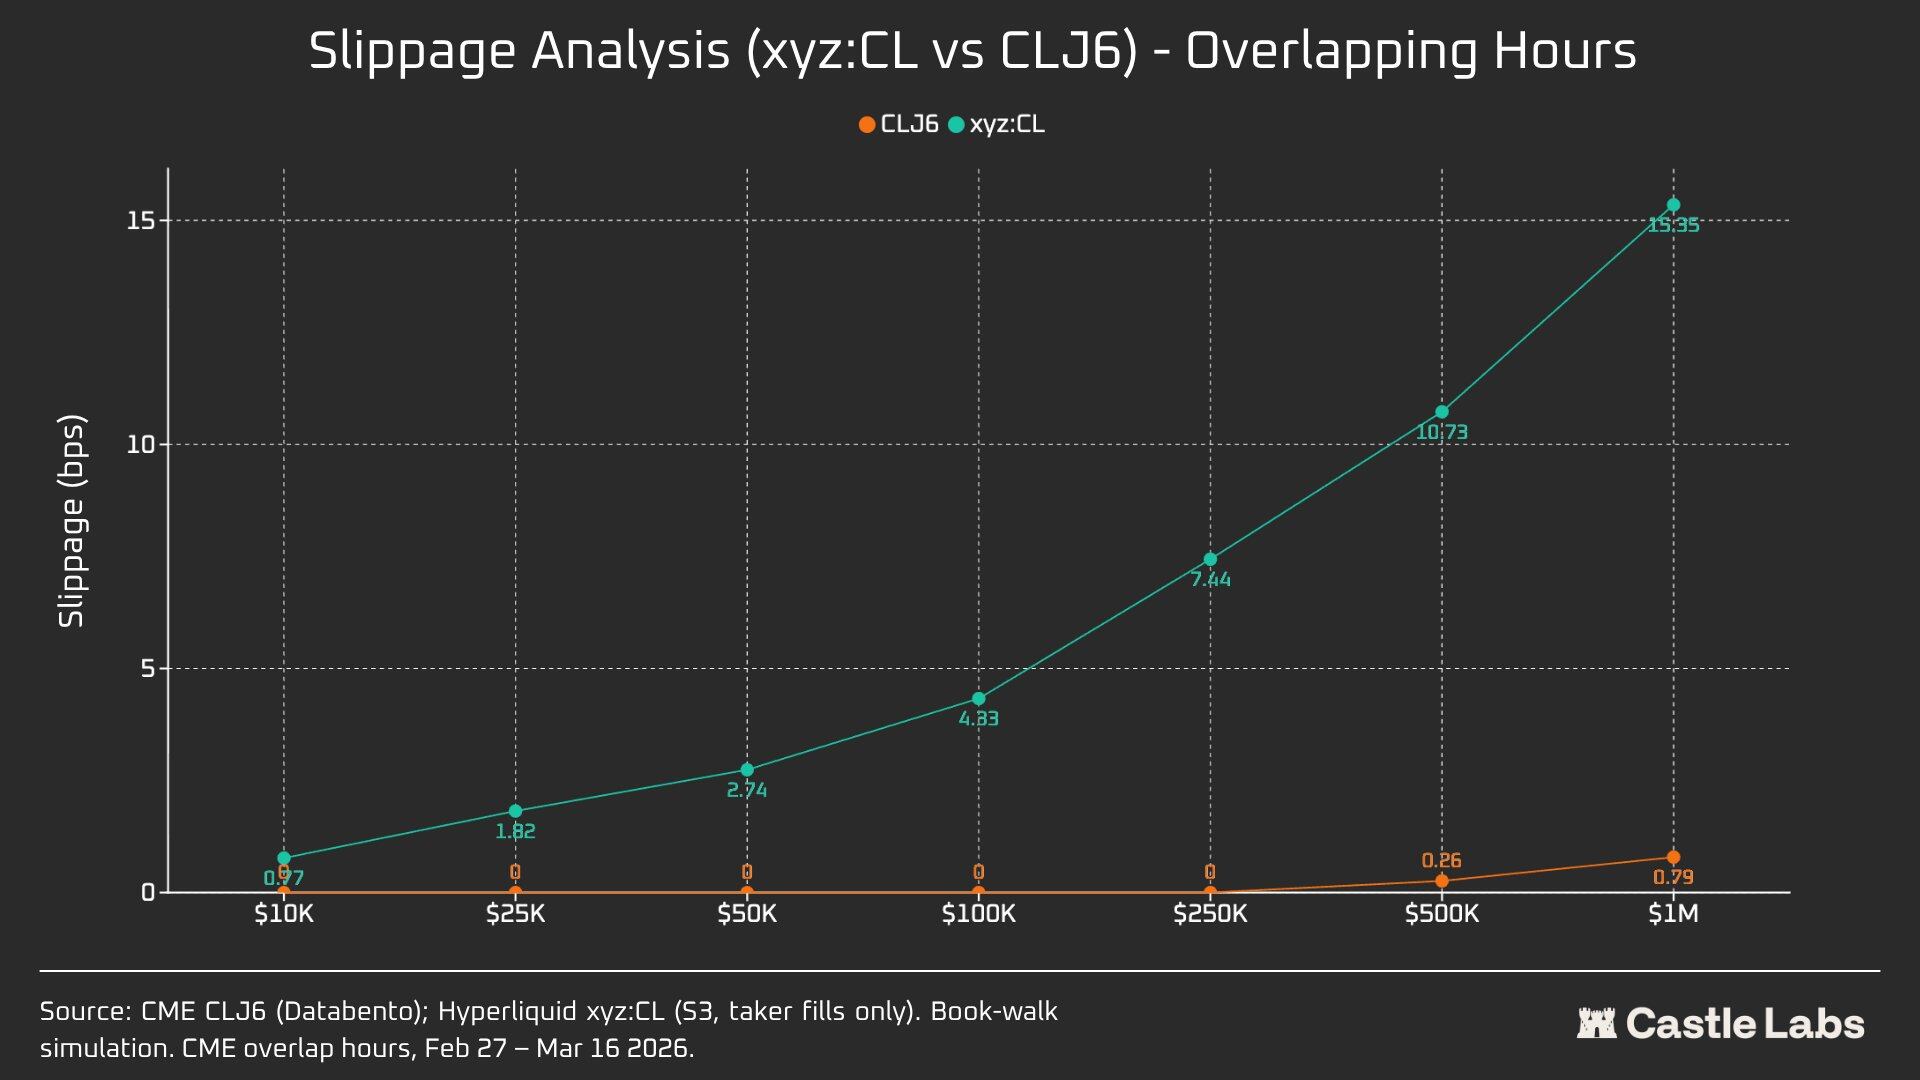
For orders of $10,000, CLJ6 traders experienced no slippage, as expected, while the median execution slippage for Hyperliquid users was less than 1 basis point, at 0.77 basis points. The difference arises with orders of $100,000, where slippage for Hyperliquid users rises to 4.33 basis points, approaching the 5 basis point threshold, while CME CLJ6 traders experience no slippage.
It is worth noting that this is higher than the median transaction size in the CLJ6 market ($90,450).
With a transaction size of $1 million, Hyperliquid's 15.4 basis points is about 20 times that of CME's 0.79 basis points, confirming that the trading venue is not yet capable of handling institutional-level orders.Given Hyperliquid's average transaction size, the platform could easily provide the same high-quality service to users without slippage.
CLJ6 orders only start to show significant slippage when the transaction size is around $500,000, affecting their execution.
When we extended the order size analysis to the weekend, slippage decreased across all order sizes, particularly for orders of $100,000 and $1 million, indicating market maturity. The decrease in slippage for simulated orders over the three weeks of analysis is as follows:
- $10,000: -16%
- $100,000: -75%
- $1 million: -86.9%
financing interest rate
CL funding rates fluctuate significantly during the CME closing session but less so during the settlement session. This helps us understand the market's internal pricing dynamics outside of trading hours. The weekend opening means the CL market can utilize internal price discovery mechanisms (supported by DB and other risk mitigation mechanisms). Therefore, funding rates are expected to be more volatile, as highlighted below.
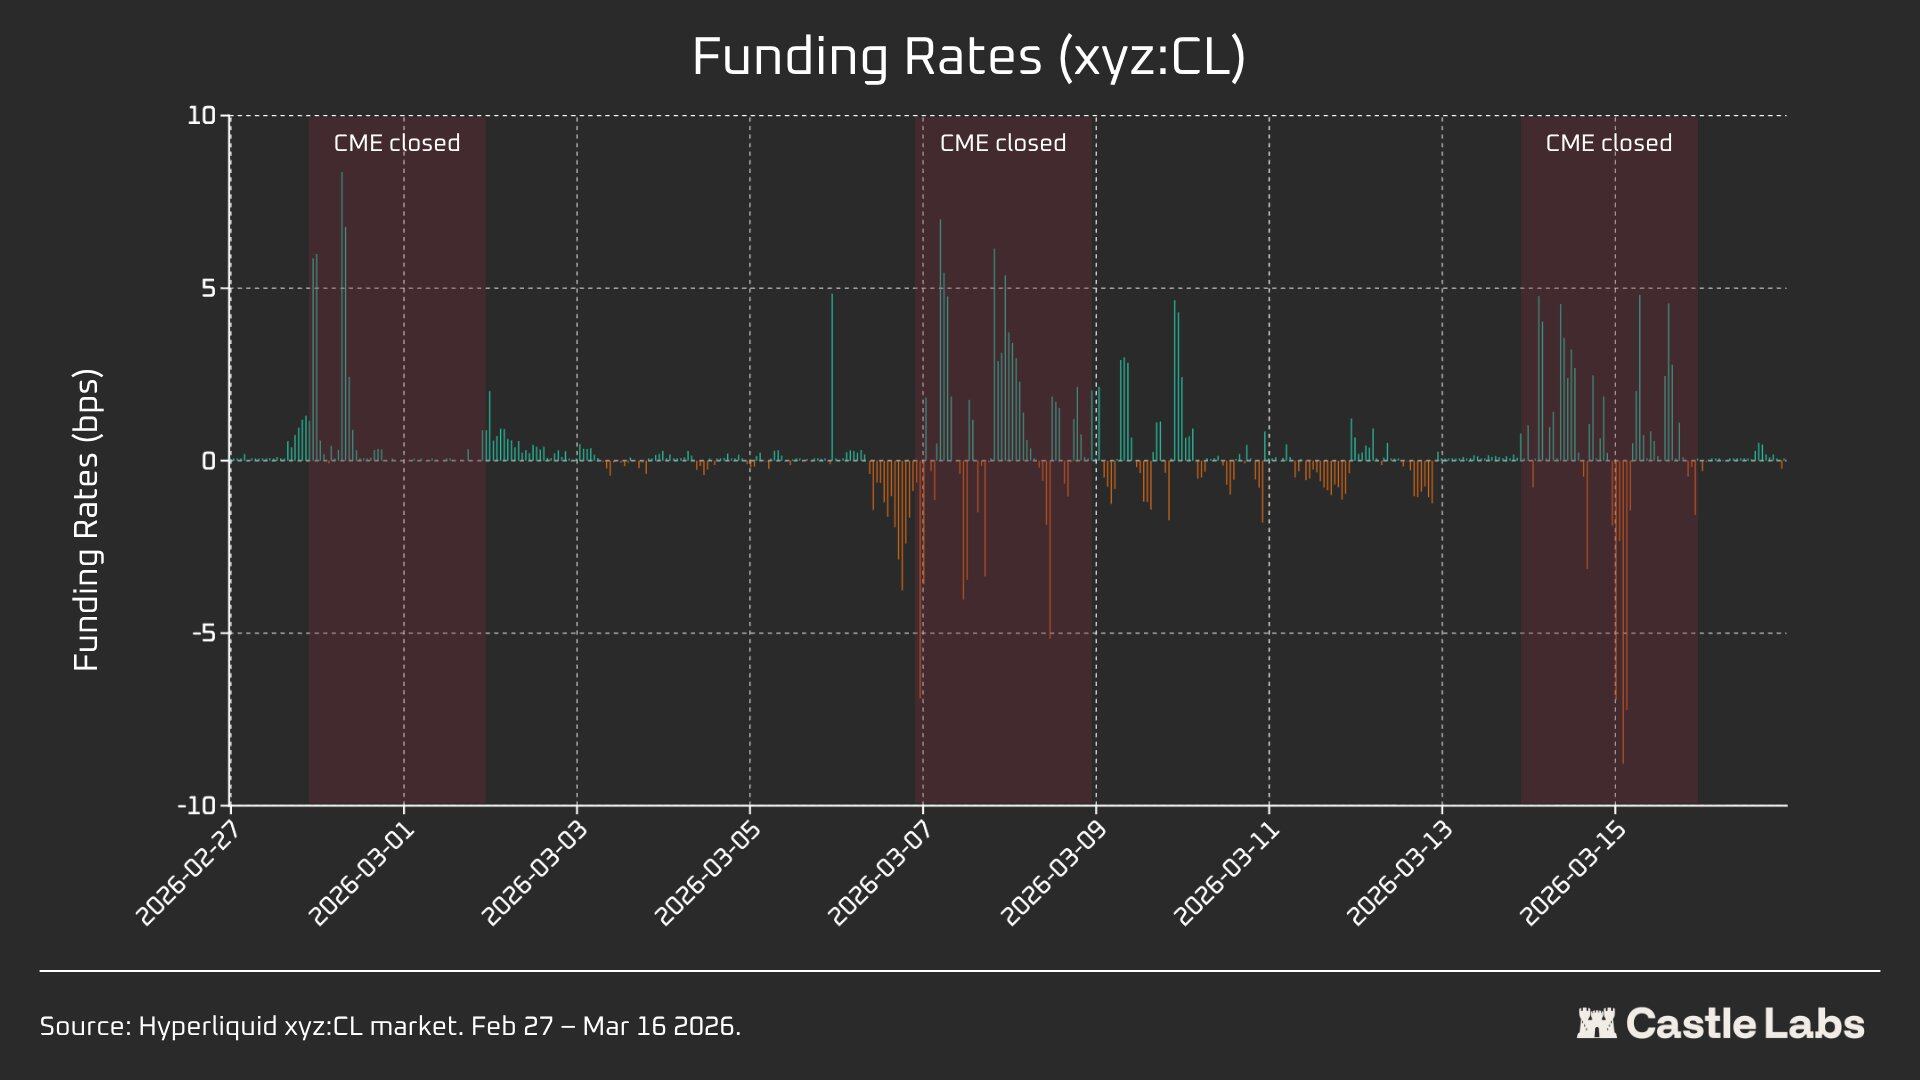
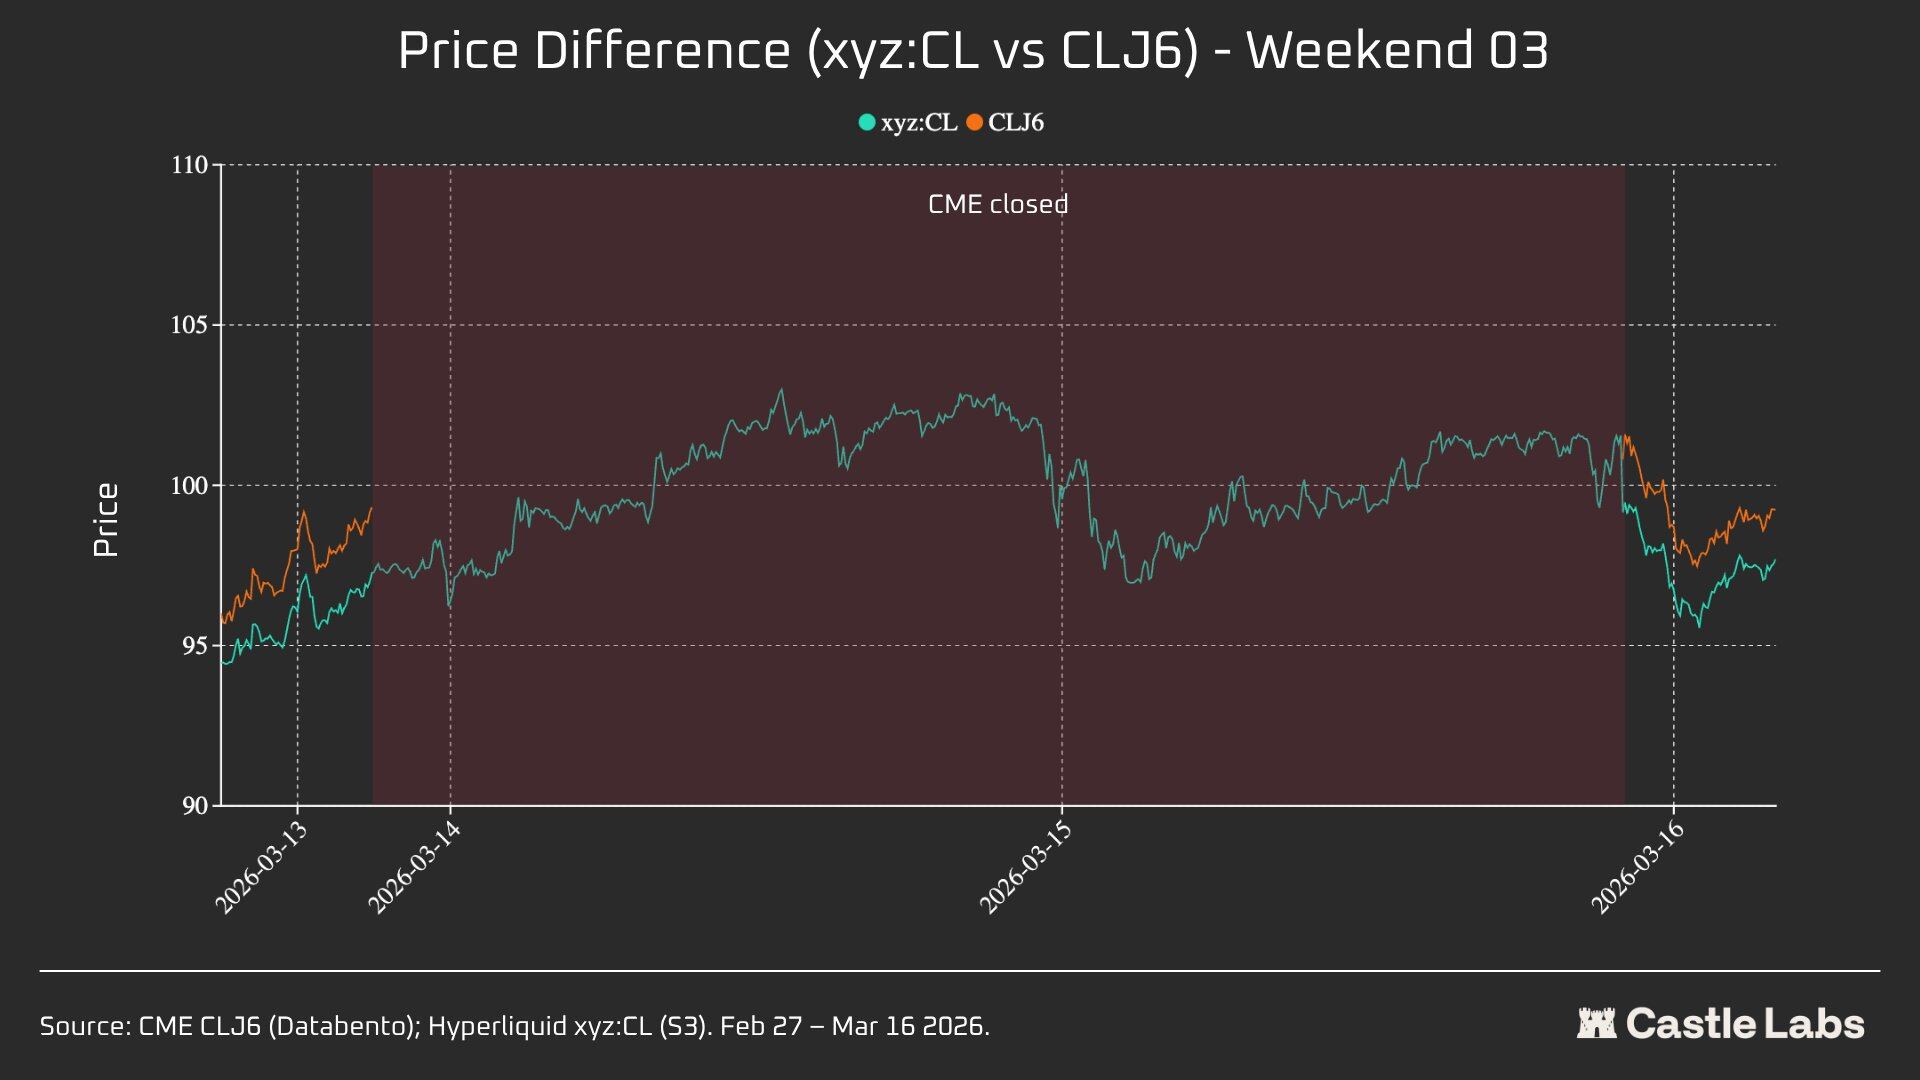
During active trading hours, Hyperliquid's xyz:CL and CME's CLJ6 move closely together, but as oil prices rise, a structural discount emerges and widens, likely due to funding rate pressures from accumulated long positions.During the weekend, with the CME closed, Hyperliquid's price discovery is further constrained by the price range mechanism (DB), which limits the volatility of the marked price in the absence of a real-time reference market.
Weekend session analysis: Hyperliquid has developed price discovery capabilities.
These three weekends have showcased the rapid maturation of the Hyperliquid market:
W1: February 28 to March 1, 2026 (Iranian attacks)
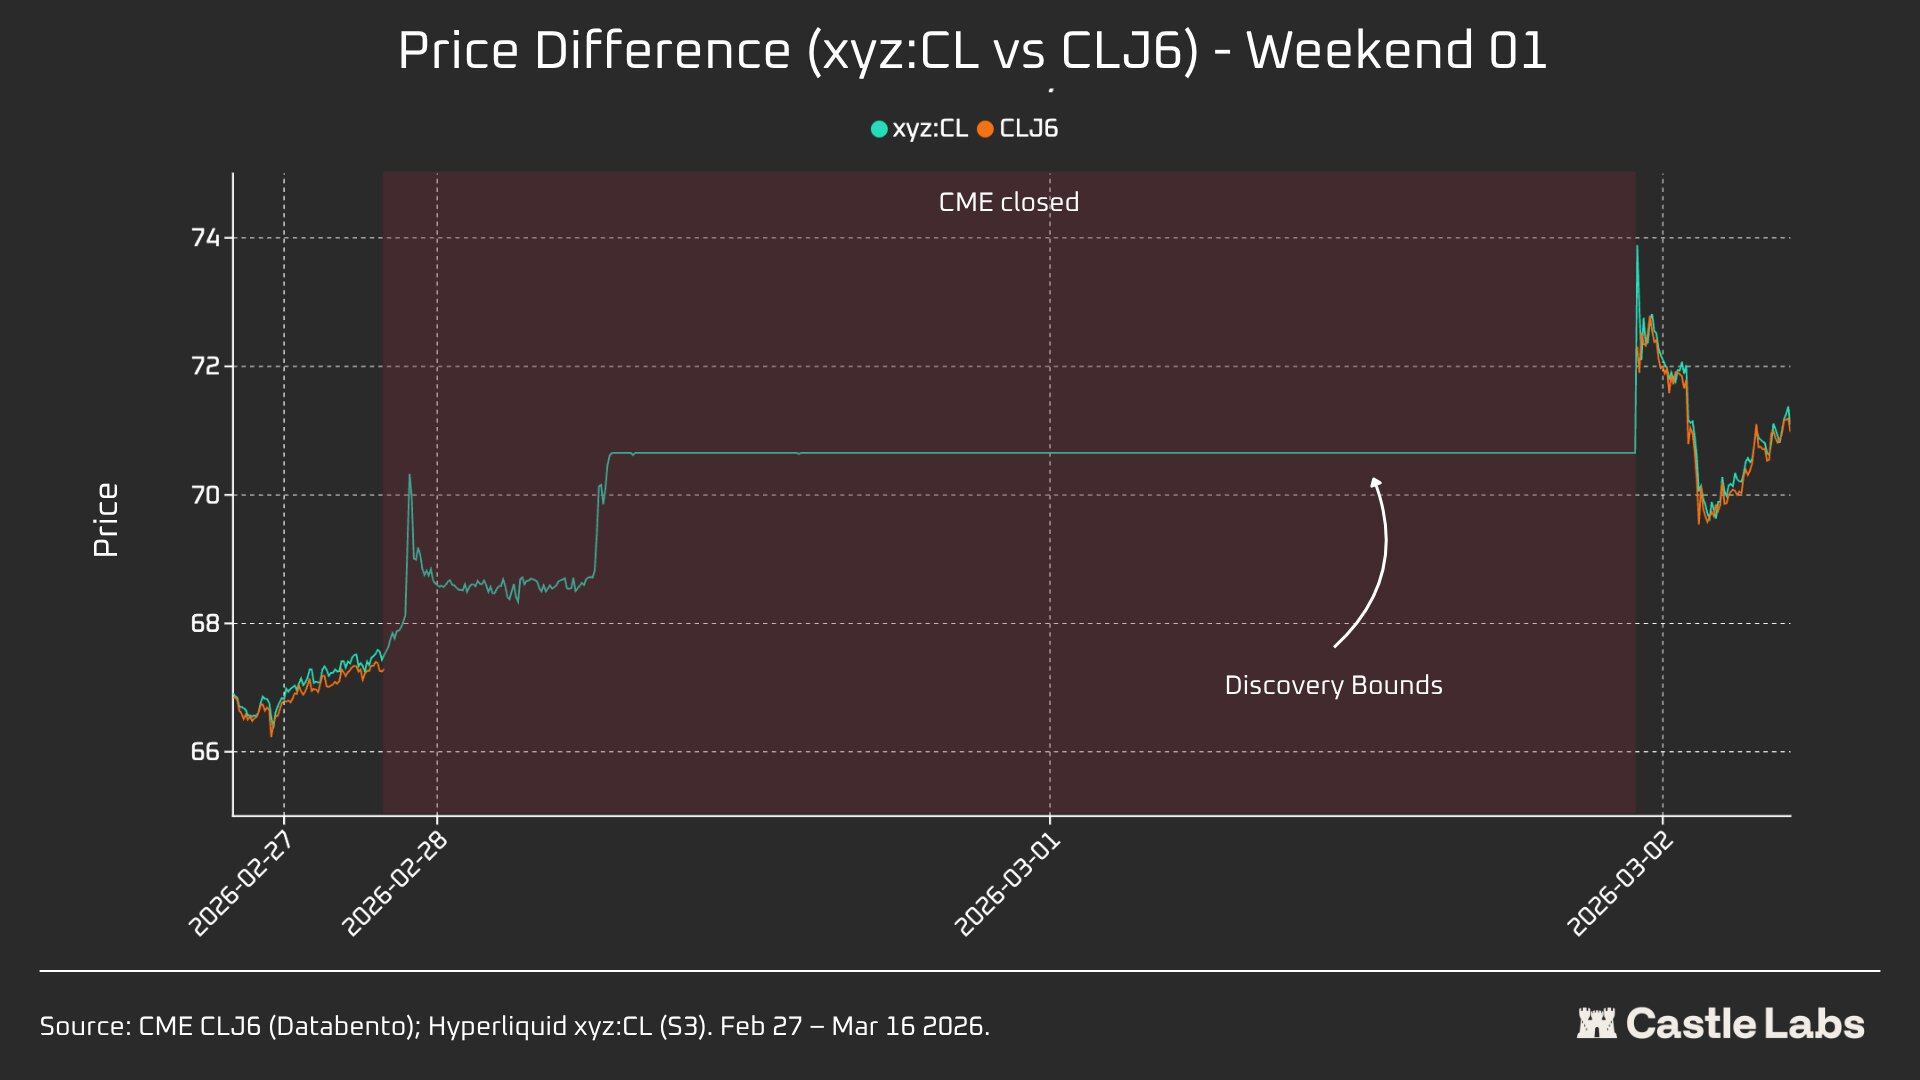
The price on Hyperliquid rose from around $67.29 on the CME to around $70.80, representing about 45% (+1146 basis points) of Monday's final gap up to $75.
It's important to note that price discovery was limited this weekend due to trade.xyz's ±5% price range limit (DB) mechanism mentioned above. This explains the relatively flat curve in the chart and the gap up on Monday. Nevertheless, in the first second after the paired data was released, the gap between Hyperliquid xyz:CL ($73.89) and CME CLJ6 ($75) was within 1.5%.
This is not a "mistake" or a "failure," but rather a risk protection achieved through market design. Therefore, from a data perspective, the first weekend has the lowest correlation, but it highlights xyz:CL's initial reaction to the Iranian airstrikes and also acknowledges the importance of the DB as a weekend price discovery mechanism, especially for emerging markets.
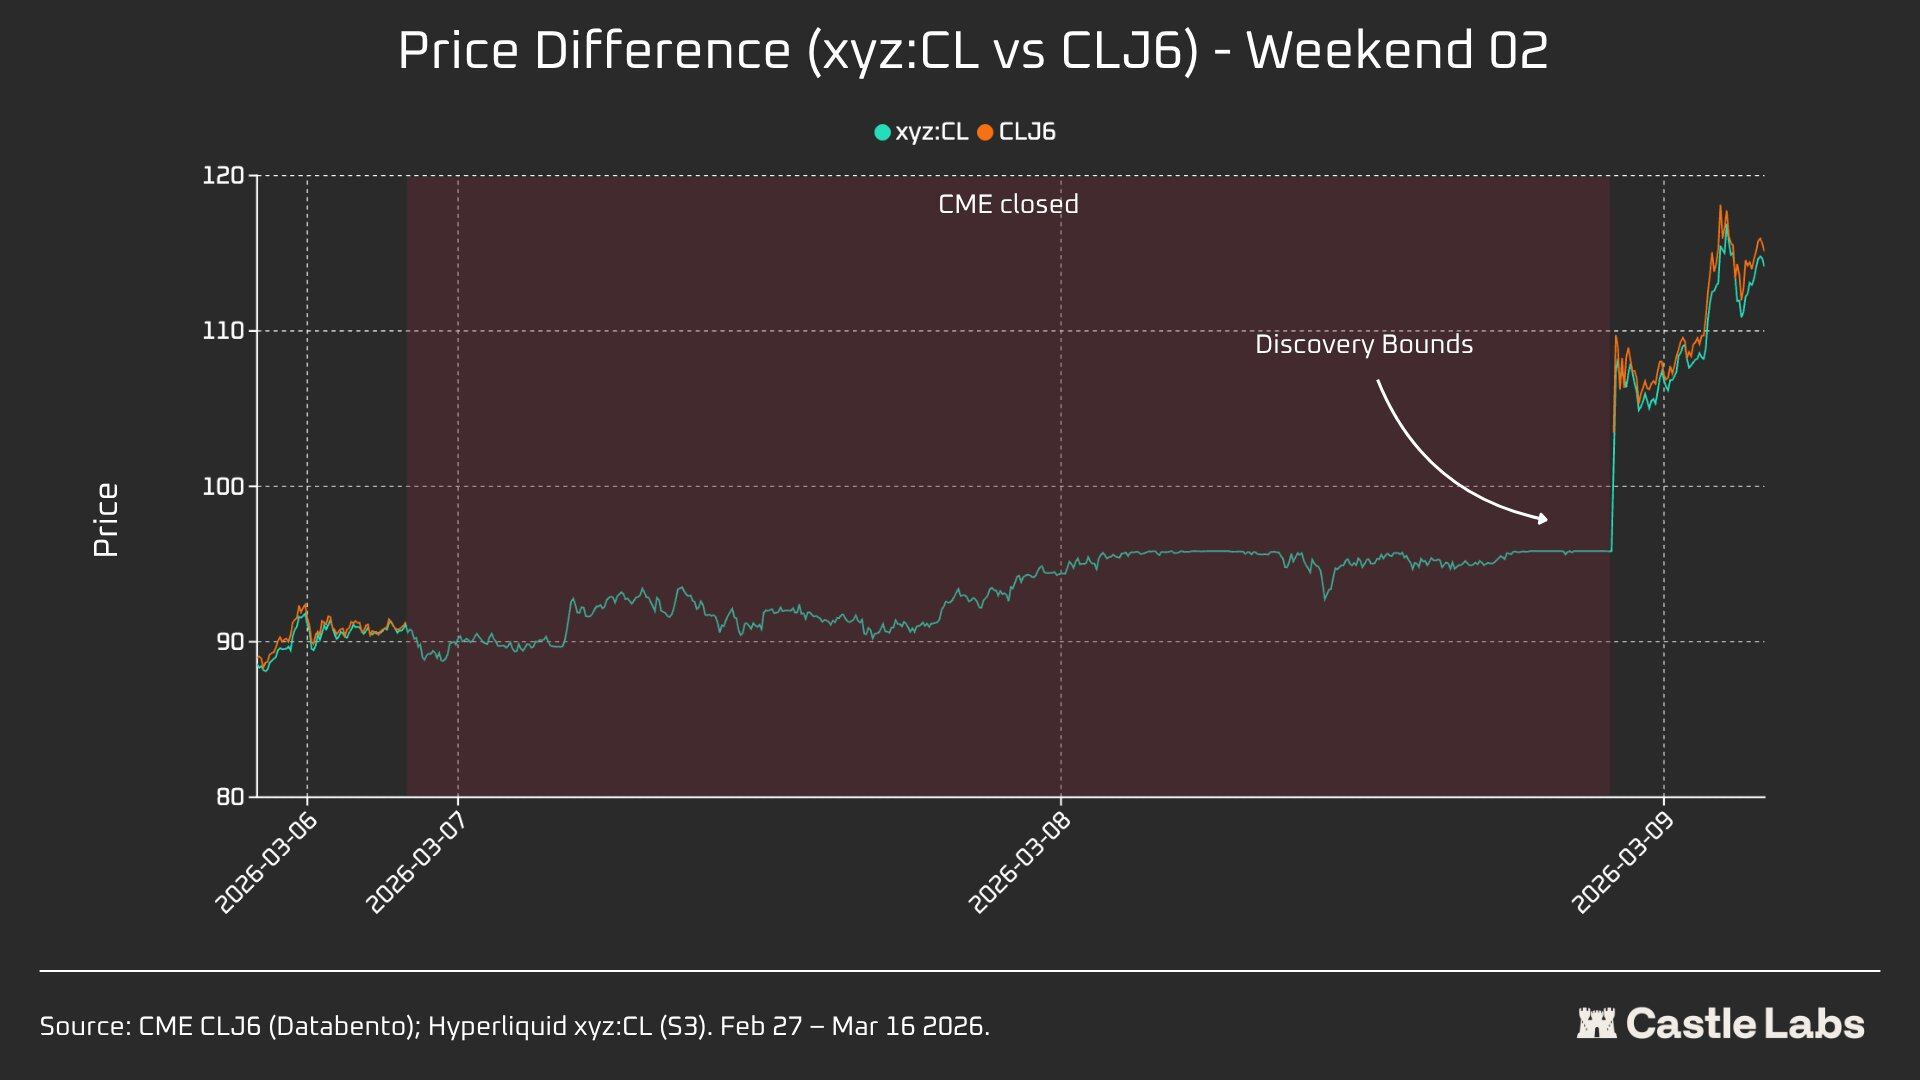
W2: March 7 to March 8, 2026
The second weekend proved to be the real test, as xyz:CL touched the upper limit of its trading range in the final minutes of trading. CLJ6 opened at $98 (up 737 basis points from the closing price of $91.27), while xyz:CL reached a high of approximately $95.83, capturing only a 68% gain.
Over the second weekend, xyz:CL captured market movements better and came closer to the CME opening price than the previous weekend.
W3: March 14 to March 15, 2026
Data from the third weekend suggests that, in a relatively calm market environment, Hyperliquid can more reliably predict the final opening direction of the CME..
The convergence of xyz:CL and CLJ6 was at its best this weekend: both rose 226 basis points from the CME closing price, slightly higher than Monday's opening price by 62 basis points. CLJ6 closed at $99.31 on Friday, opening at $100.93 (up 163 basis points), while xyz:CL opened at $101.56.
In summary, these three snapshots reveal structural changes in the xyz:CL market on the Hyperliquid platform.The market transitioned from emerging markets constrained by DB price discovery (weekend 1 and weekend 2) to markets with increasingly free price discovery, resulting in overshoots and pullbacks (weekend 3).
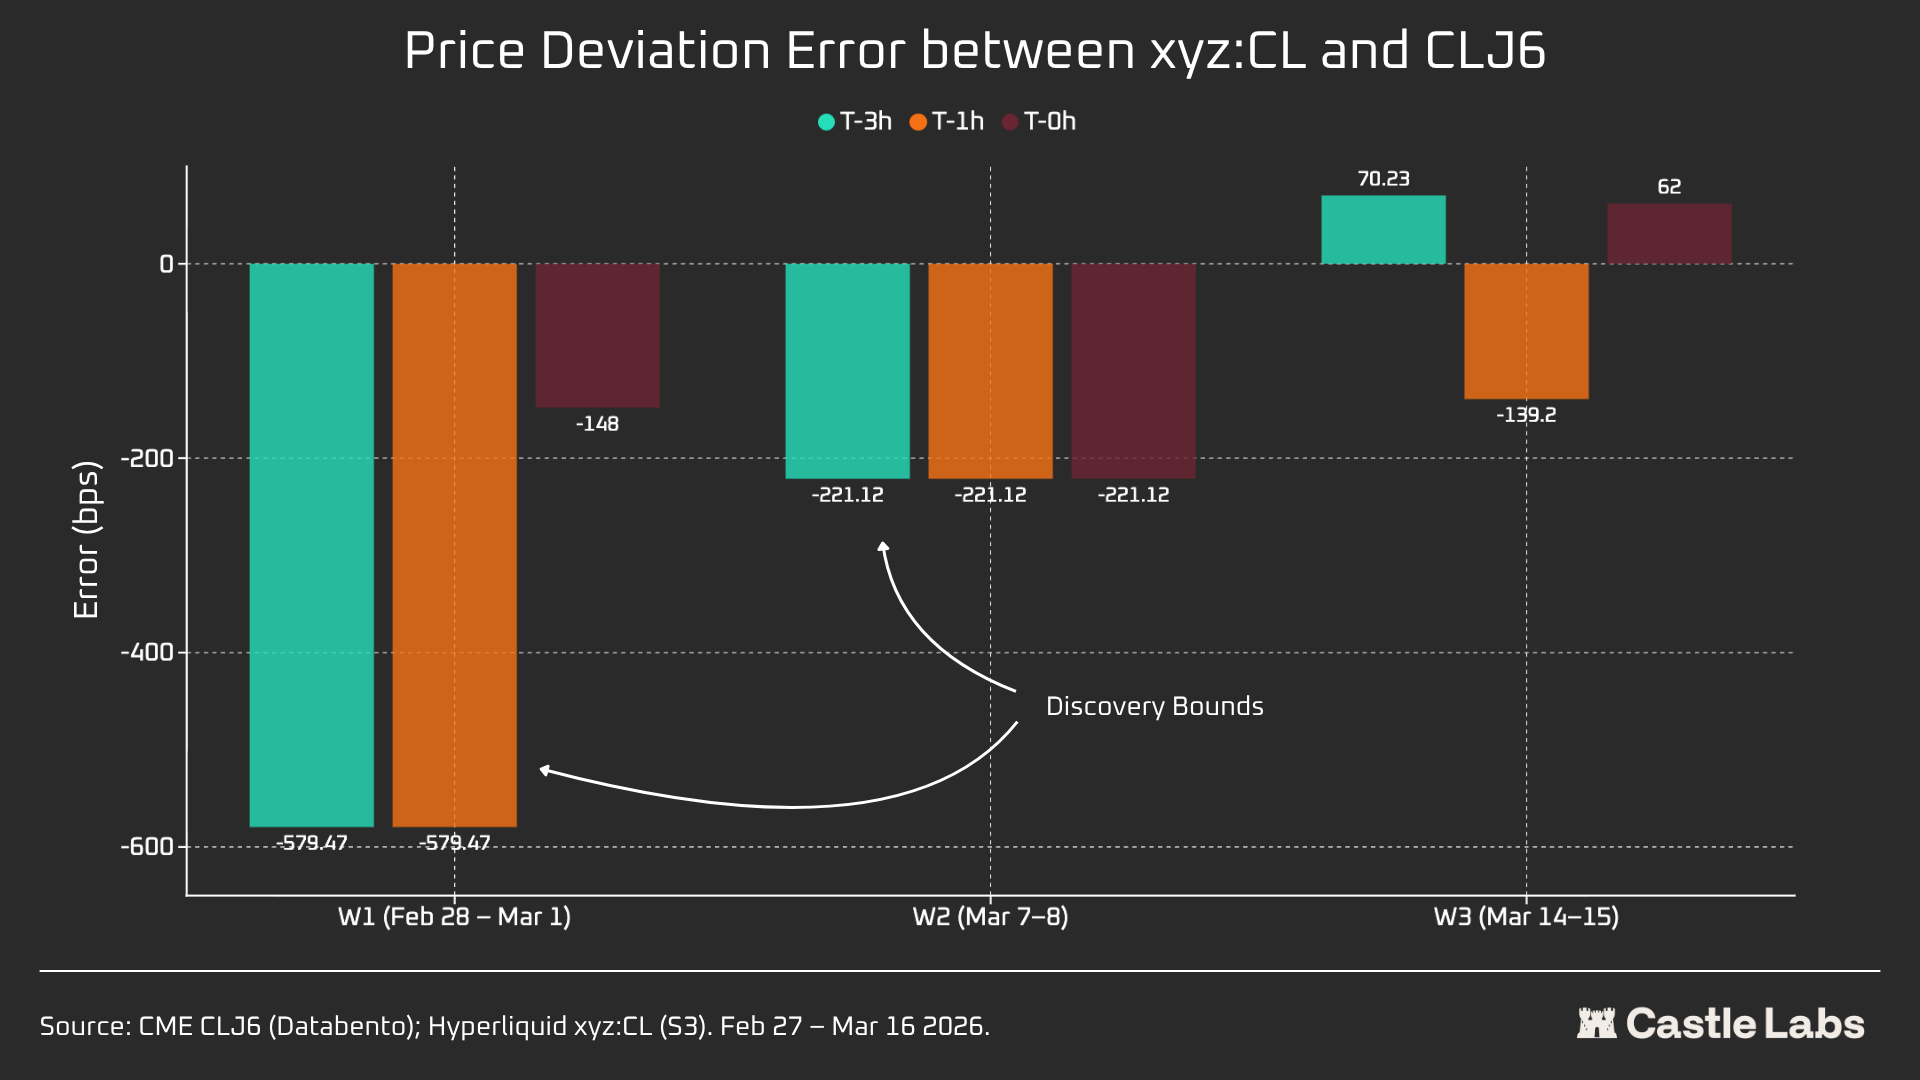
Analyzing price deviation errors at different times (3 hours, 1 hour, and 0 hours) before the CME market opens on different weekends reveals that the data from Week 3 is the most reliable, as the xyz:CL market was influenced by DB on the previous two weekends. In Week 3, the errors for xyz:CL 3 hours and 1 hour before the CME market opens are approximately +70 and -139 basis points, respectively, indicating that its price discovery ability is better than the previously analyzed weekends.
Other indicators
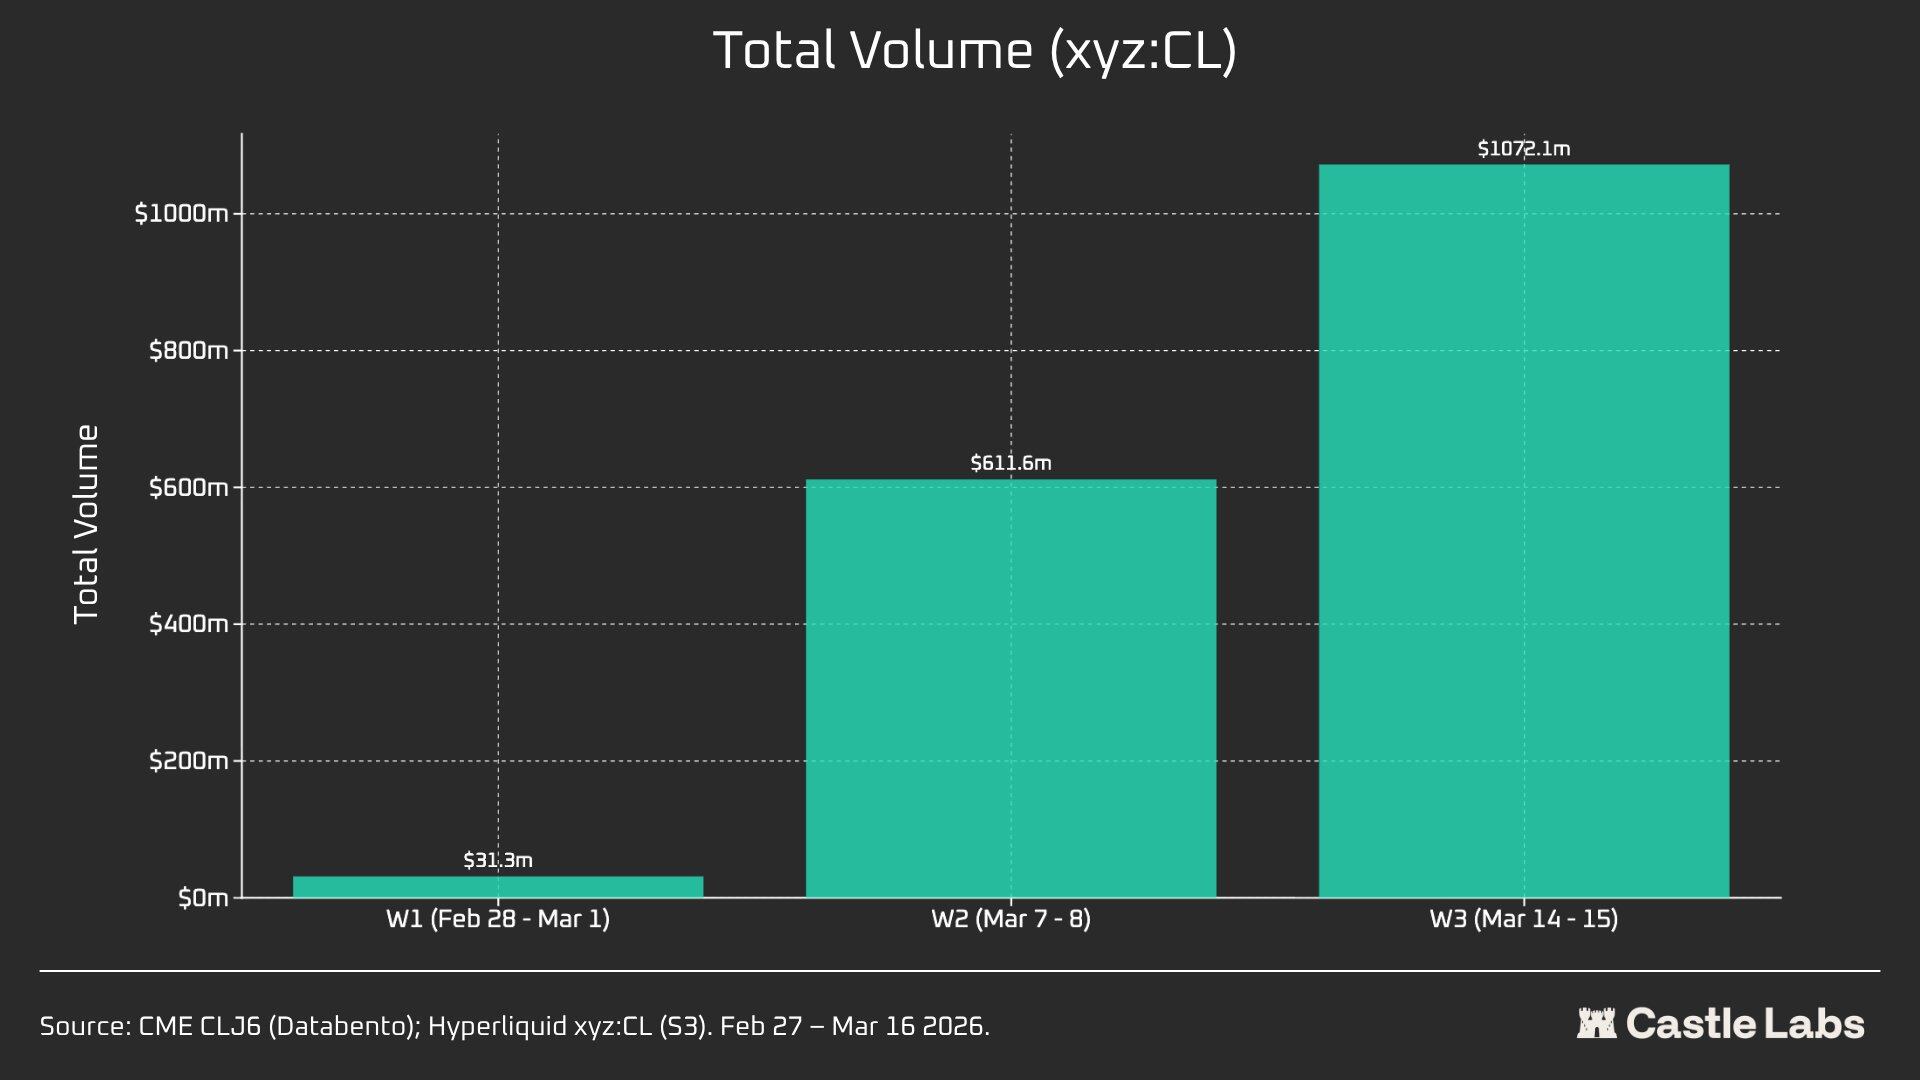
We also provide other metrics for our weekend summary analysis, including trading volume, total number of trades, and average trade size. These metrics vary between weekends and show a consistent upward trend over several consecutive weekends.
The total transaction volume of the xyz:CL market grew from $31 million to over $1 billion in three weeks, reflecting the increase in the number of users and the eventual maturity of the market.
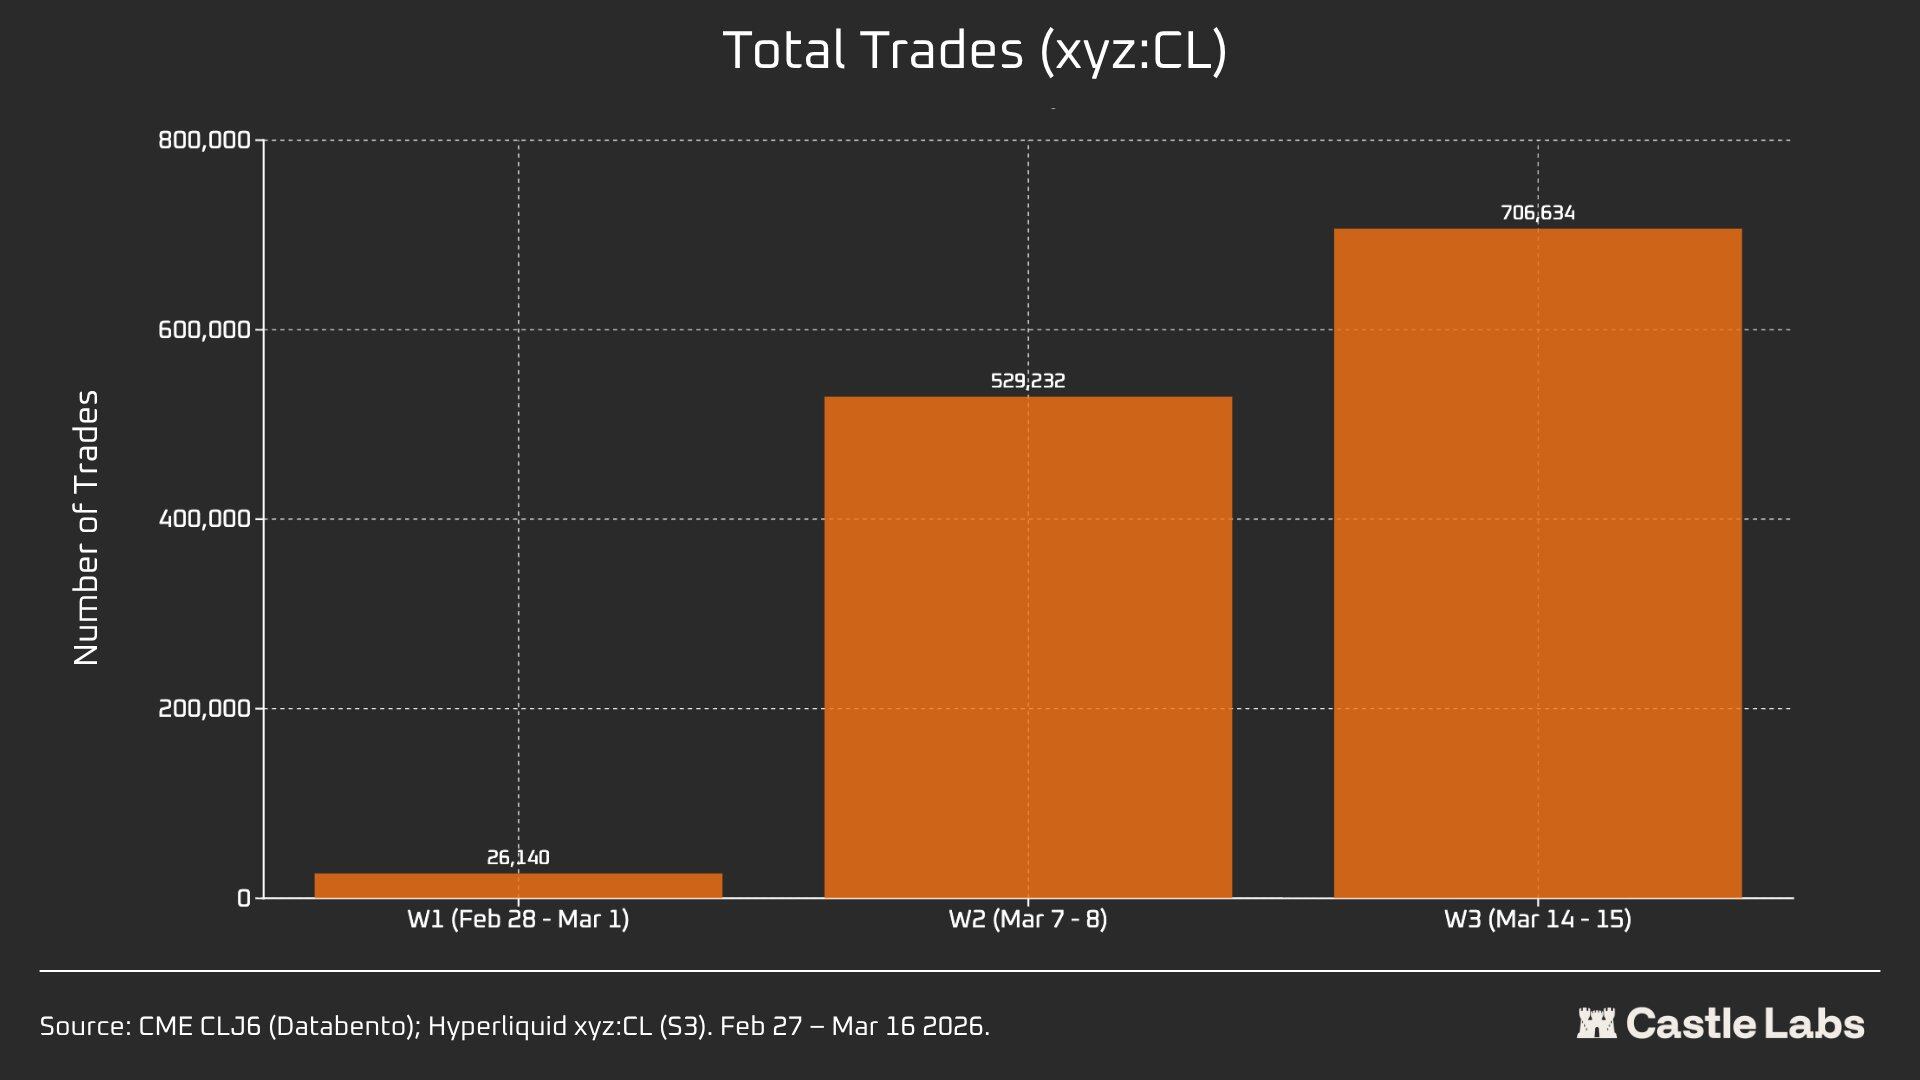
In addition, the total number of transactions increased from 26,000 at the first weekend to more than 700,000 at the third weekend.
It's worth noting that the average trade size over the weekend actually increased from the median we mentioned earlier to $534. The same upward trend was observed across all three weekends, which likely indicates more institutional funds flowing into the market.
The average trade size was $1,199 over the first weekend, growing to over $1,500 by the third weekend.
This could indicate that the user base using the platform differs over the weekend, with fewer retail users and more traders needing to gain exposure to crude oil trading before Monday.Therefore, weekend trading is more about hedging needs than speculation.