

Author:Encryption Tracker
Bitcoin continues to move within a bearish technical structure, yet persistent accumulation by Michael Saylor’s Strategy is beginning to challenge that outlook.
Notably, Bitcoin (BTC) remains within a bear flag formation, a setup that typically signals further downside. Under normal conditions, this pattern could indicate a move below the crucial $60,000 support region to new lows.
However, recent market behavior suggests that strong demand from Strategy, the largest Bitcoin treasury firm, may be offsetting this pressure.
Key Points
- Bitcoin (BTC) remains within a bear flag formation.
- Recent market behavior suggests that strong demand from Strategy may be offsetting the pressure.
- Strategy has added 46,233 BTC to its holdings since March 2, nearly three times the 16,200 BTC miners have produced over the same period.
- Despite the ongoing bearish setup, a break above the upper boundary of the bear flag around $75,000 would invalidate the bearish continuation pattern.
- If this occurs, attention could shift toward a projected move between $108,000 and $110,000.
Persistent Strategy Bitcoin Buying Counters Bear Flag
For context, Saylor’s Strategy has added 46,233 BTC to its holdings since March 2. Over the same period, miners produced approximately 16,200 BTC, meaning the firm has absorbed nearly three times the new supply entering circulation. This imbalance has played a key role in stabilizing price action and could tend towards a BTC supply shock if such buying pressure persists.
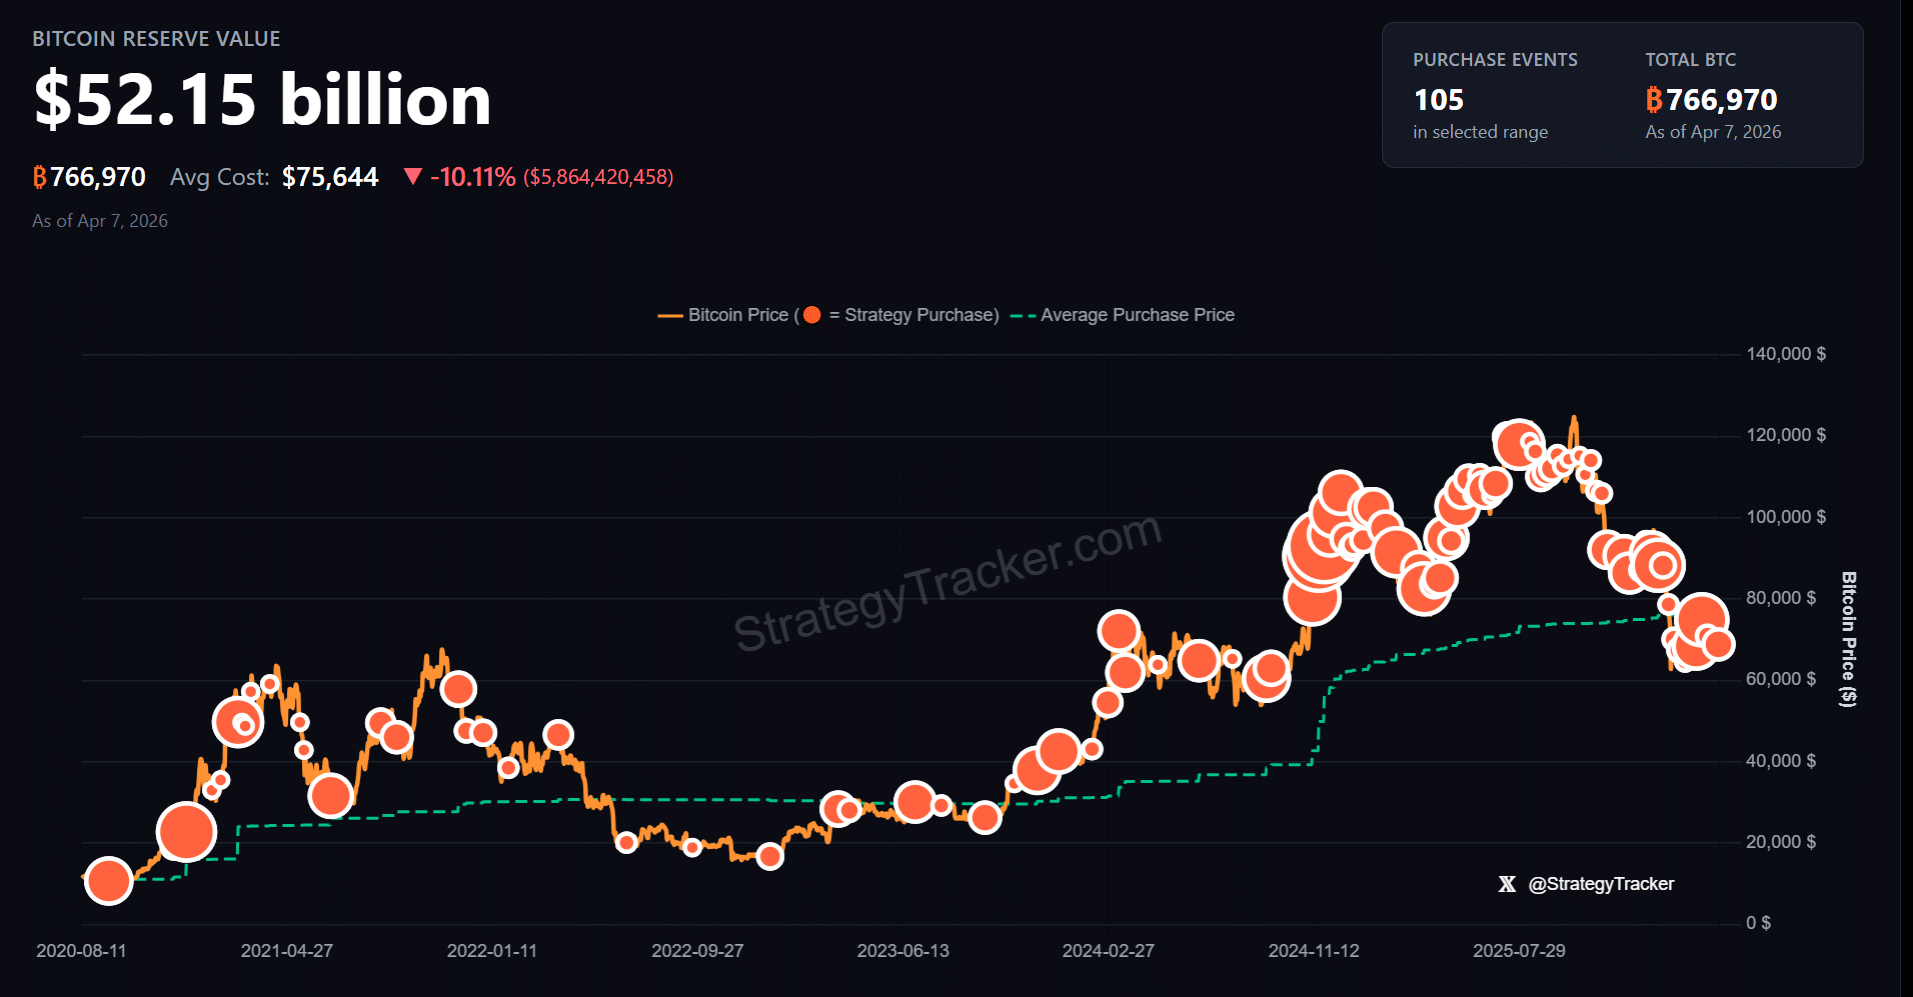
Notably, many of the purchases have come in through STRC, Strategy’s perpetual preferred stock with an 11.5% annual return, which it has repeatedly used to raise capital for Bitcoin purchases.
Strategy recently secured $102.6 million through STRC sales last week, contributing to its acquisition of 4,871 BTC worth $330 million. This activity possibly contributed to Bitcoin’s 4.6% growth last week and its strong opening to this week.
Earlier in March, between March 9 and 13, STRC-related funding reached $776 million. This capital supported the purchase of more than 11,000 BTC, contributing to the premier asset’s 12% rally during the same period, despite the S&P 500 dropping 1.6%. BTC ended that week with a 10.3% increase, its highest weekly gain since May 2025.
At the same time, a decline in STRC issuance has coincided with notable pullbacks. In mid-March, when the stock dipped below its $100 reference level, issuance declined, and Bitcon dropped nearly 7%. A similar event in January aligned with the 25% corrections in three weeks from $97,900 to $60,130.
Bitcoin Targets Higher Prices if Breakout Occurs
Despite the ongoing bearish setup for Bitcoin, a move above key resistance could change the outlook. A break above the upper boundary of the bear flag around $75,000 would invalidate the bearish continuation pattern.
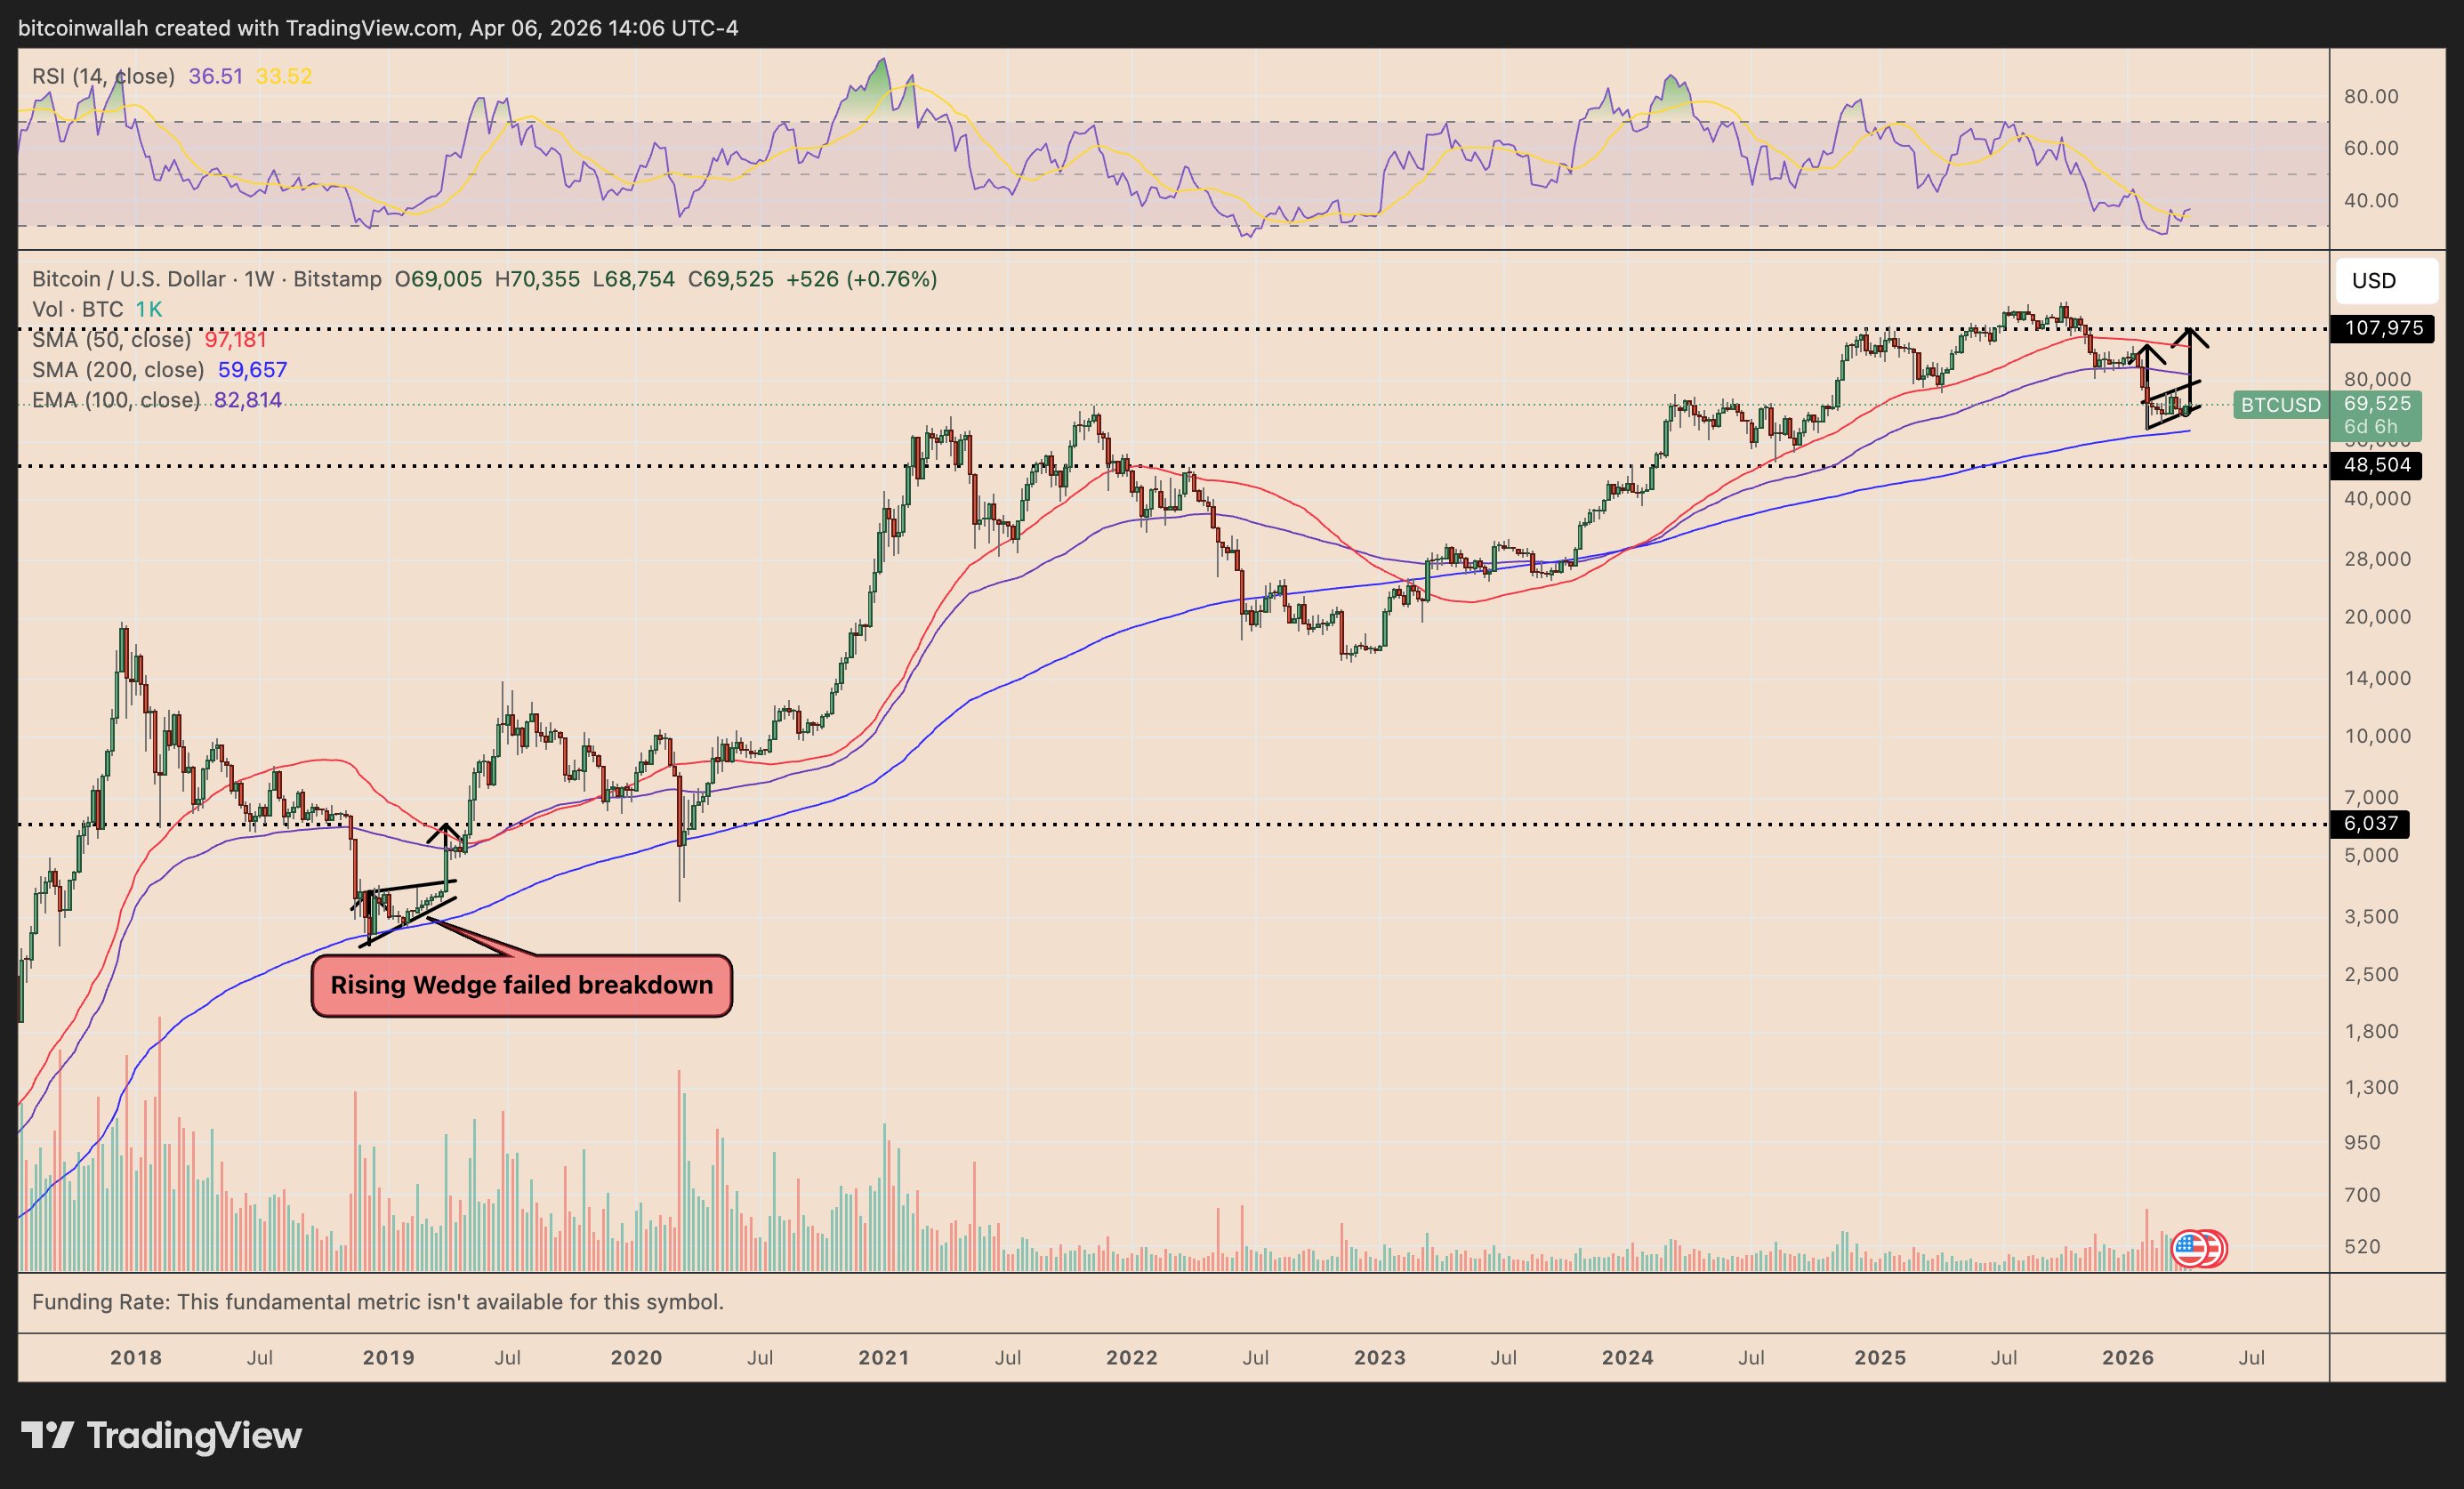
If this occurs, attention could shift toward a projected move between $108,000 and $110,000, where the next major resistance level lies. Notably, this scenario mirrors past behavior, including a similar pattern failure observed around Bitcoin’s 2018 bottom.
The asset broke upward from a typically bearish rising wedge in April 2019 after falling into and consolidating within this pattern from November 2018. It bottomed within this pattern with support from the 200-week simple moving average. What followed was a 2,109% price expansion from the lows around $3,124 to the 2021 peak of $69,000.
In the current cycle, the same 200-week MA limited further downside attempts in February, suggesting that a base may be forming. Historically, this level has acted as a bottom during major corrections and could provide the required momentum for the 59% and 62% rallies to reach between $108,000 and $110,000.